

Think cap rates don’t move fast? Think again.
Official cap-rate stats lag closed deals by weeks or months, but you can read the market in near real time.
Watch fast-moving signals—the 10-year Treasury, REIT prices, mortgage spreads, and local vacancy or permit news—to see effective cap-rate shifts before appraisals catch up.
When those signals point wider, expect prices to soften; when they compress, valuations tighten and you’ll pay more.
This week’s moves can change what you should offer, how you finance, or whether to wait.
Weekly Cap Rate Trends and What They Mean for Rental Investors

Cap rates don’t show up weekly like mortgage rates. They need closed deals and appraisals, so the official numbers come weeks or months late. But you can still track effective weekly changes by watching faster-moving signals that usually lead cap rate shifts.
When the 10-year Treasury spikes 25 basis points in a week, public REIT prices drop 3%, or mortgage spreads widen hard, you’re watching cap rate pressure happen live. The formal private-market data won’t catch up for another quarter. That lag doesn’t matter much once you know what to read. Rising effective cap rates mean prices are softening compared to income. Falling rates signal tighter valuations and fiercer competition.
The tactical read is simple: if weekly signals point to wider cap rates, wait if you can. Prices should drift lower. If signals show compression, move faster or you’ll pay more. Historical data shows a +0.7 correlation between Treasury yields and cap rates over decades, so big weekly Treasury moves are solid early warnings.
Four weekly signals worth tracking:
- 10-year Treasury yield week-over-week moves (25+ basis points often come before cap rate shifts)
- Public REIT price trends (sector-specific REIT action can lead private valuations by weeks)
- Mortgage rate and spread shifts (wider spreads raise financing costs and push cap rates up)
- Local competition and vacancy numbers (sudden inventory jumps or new construction news compress rents and widen cap rates)
Understanding Capitalization Rate Mechanics in Weekly Market Analysis
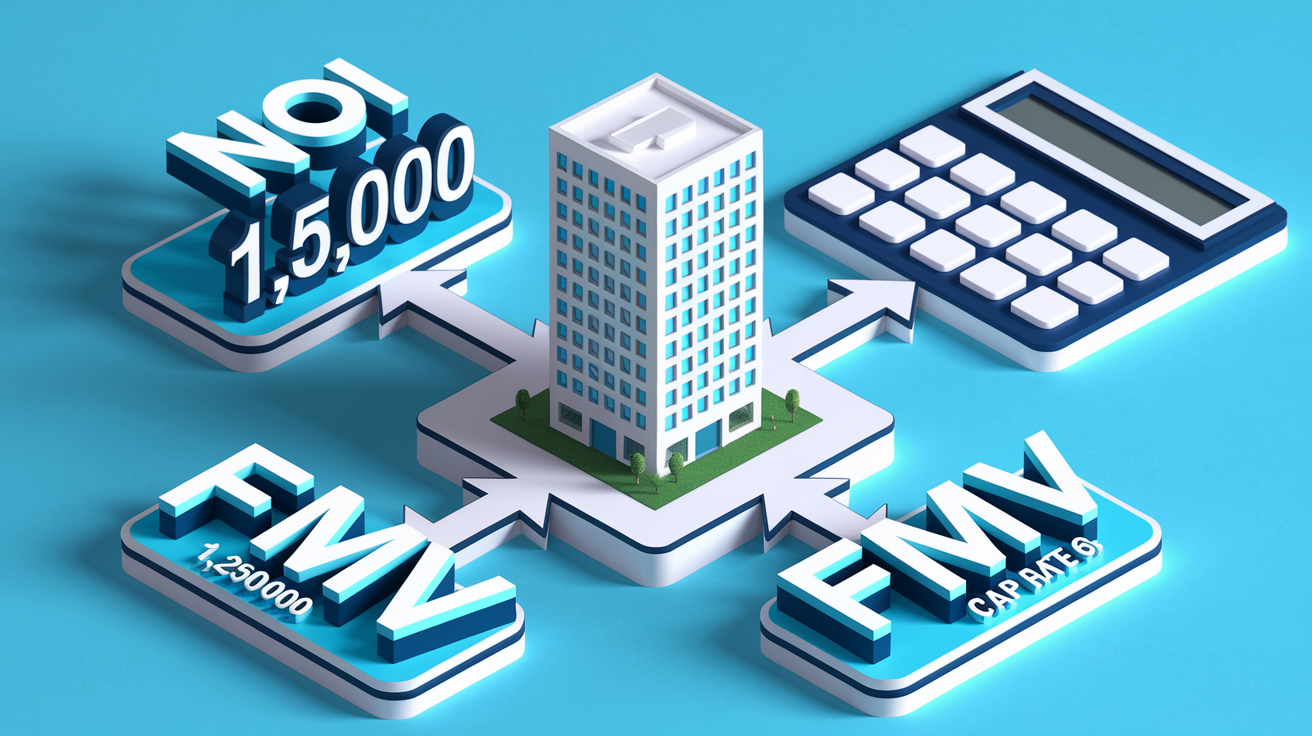
Cap rate equals net operating income divided by property price. A small weekly change in either piece (rent collected, operating costs, or comp sale prices) moves your calculated rate right away. When a nearby property sells at a 6.2% cap instead of last month’s 5.8%, your asset’s implied value just dropped if NOI stays flat.
The math is easy, but weekly sensitivity runs high. If your NOI is $75,000 and the market comp shifts from $1,300,000 to $1,250,000, your effective cap rate jumps from 5.8% to 6.0%. That’s a 20-basis-point expansion signaling either falling prices or higher yield demands. Track weekly comp sales, lease signings that change projected rent, and sudden cost spikes (insurance renewals, tax reassessments) because each feeds straight into the formula. Mortgage payments don’t show up in cap rate math, so rising debt service alone won’t change your published cap rate. But it will change whether the property works at that cap rate.
Three formula steps to run weekly:
- Calculate NOI: total annual rental income minus annual operating costs (repairs, insurance, property taxes, management fees).
- Find current fair market value: use recent comp sales or an updated appraisal if you’ve got one.
- Divide NOI by FMV and multiply by 100 for the percentage.
| Component | Description |
|---|---|
| Net Operating Income (NOI) | Annual rental income minus annual operating costs; excludes debt service and capital expenditures. |
| Fair Market Value (FMV) | Current purchase price or appraised value based on recent comp sales. |
| Cap Rate | NOI ÷ FMV × 100%; shows income yield independent of how you finance it. |
Weekly Cap Rate Movement Drivers Across U.S. Markets

Cap rates respond to credit availability, inflation expectations, unemployment trends, and how fast mortgage debt grows versus GDP. When mortgage debt expands 100 basis points faster than GDP, multifamily cap rates typically widen around 22 basis points. Office cap rates widen roughly 65 basis points. That relationship unfolds over quarters, but weekly volatility in credit markets (sudden spreads on commercial mortgage-backed securities, fund redemptions, bank pullbacks) can speed it up or slow it down.
Inflation expectations matter more than headline inflation. If markets price in sustained higher inflation, nominal rent growth can keep pace with rising rates and cap rate expansion slows. When inflation expectations fall while rates stay high, real yields spike and cap rates widen faster. Unemployment shifts change tenant credit quality and lease renewal risk, so weekly jobless claims or payroll surprises can move sentiment before they show up in actual vacancy rates.
Supply and demand dynamics stack on top of macro forces. A metro seeing weekly permit data surge will face future inventory pressure that widens cap rates before those units deliver. A market with falling permits and rising absorption can see cap rate compression even as national rates climb. Geographic variation is wide. Coastal gateway cities often show lower cap rates and slower weekly movement. Secondary and tertiary markets can swing 50+ basis points in a month when capital flows reverse.
High-Frequency Market Signals to Watch
The 10-year Treasury yield acts as the baseline risk-free rate for most cap rate models. When the 10-year moves above 5%, historical patterns suggest CRE valuations face another 10% to 15% downside if fundamentals don’t improve. Weekly Treasury moves of 15 to 25 basis points are common during Fed pivot speculation or inflation surprises, and those shifts immediately reprice the spread investors demand over Treasuries.
Fund flow volatility (open-ended fund redemptions, non-traded REIT outflows, closed-end fundraising drops) signals capital scarcity. When weekly flow data shows net redemptions accelerating, cap rates widen because fewer buyers compete for assets. Weekly mortgage rate changes directly affect buyer financing costs. A 50-basis-point jump in mortgage rates in one week can freeze acquisitions while buyers recalibrate underwriting, temporarily widening effective cap rates until pricing adjusts.
Weekly Cap Rate Patterns by Property Type and Asset Class
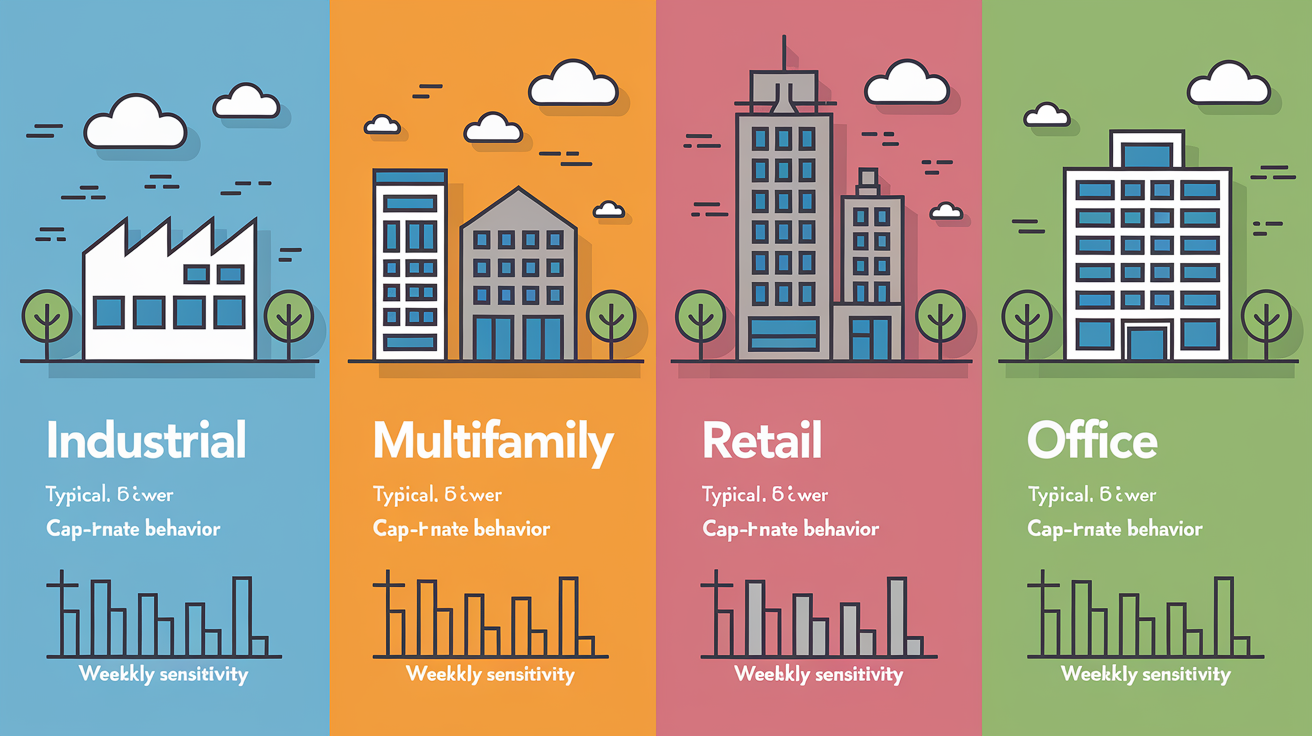
Industrial assets tolerate lower cap rates because demand stays strong and rent growth expectations are high. Retail and office properties need higher cap rates to compensate investors for weaker fundamentals and tenant rollover risk. At the end of 2021, national multifamily averaged a 4.6% cap rate, down from 5.3% a year earlier. The Pacific West (including California) sat at 3.9%, down from 4.5%. By mid-2024, office cap rates had expanded roughly 255 basis points from recent peaks, while multifamily expanded around 195 basis points.
Weekly sensitivity varies by asset class. Industrial cap rates move slowly because long-term leases and thin supply buffer short-term rate volatility. Multifamily reacts faster. Rent growth is more elastic, and financing dominates buyer decisions, so weekly mortgage rate swings directly alter bid prices. Office faces the widest swings. Remote work uncertainty and lease expirations create binary outcomes, so a single large lease renewal or vacancy announcement in a week can shift building-level cap rates by 50+ basis points.
| Property Type | Typical Cap-Rate Behavior | Weekly Sensitivity Indicator |
|---|---|---|
| Industrial | Lower cap rates; strong rent growth; stable demand | Low. Long leases and supply constraints dampen weekly volatility |
| Multifamily | Mid-range cap rates; moderate expansion during rate rises | Moderate. Financing costs and rent trends drive weekly shifts |
| Retail | Higher cap rates; weaker fundamentals; tenant rollover risk | Moderate to High. Local competition and consumer spending data move sentiment quickly |
| Office | Highest cap rate expansion; remote work pressure; lease uncertainty | High. Single-lease events or occupancy reports can swing cap rates 50+ bps in days |
How Weekly Cap Rate Shifts Affect Acquisition Strategy

Rising cap rates lower the price you should pay for a given NOI stream. When effective cap rates jump 25 basis points in a week (signaled by REIT sell-offs or widening mortgage spreads) your maximum justified offer price drops immediately. If you locked an LOI the prior week at a 5.5% cap and the market now trades at 5.75%, you’re overpaying unless the seller adjusts price or you renegotiate terms.
Forward-looking cap rate pricing protects against long-term losses. Buying at a historically low cap rate during a rising rate environment means you’re paying peak price with shrinking financing availability. When mortgage rates climb another 50 basis points and cap rates follow, your asset value can fall 10% to 15% even if NOI holds flat. Use the current week’s observable proxies (Treasury moves, recent comp sales, mortgage rate quotes) to set your required cap rate, not last quarter’s stale index.
High rate environments create acquisition opportunities for well-capitalized buyers. Loan maturities in 2024 and 2025 will force some owners to sell at elevated cap rates because refinancing is prohibitively expensive. If you can close without rate-sensitive financing or you lock favorable long-term debt now, acquiring at a 6.5% cap with a future terminal assumption of 5.5% generates meaningful appreciation when rates eventually fall.
Three weekly negotiation adjustments to consider:
- If the 10-year Treasury rose more than 20 basis points since your initial offer, request a price reduction equal to the cap rate expansion multiplied by trailing NOI.
- When mortgage spreads widen week over week, propose seller financing or a delayed close to lock current pricing while securing better debt terms.
- If a competing property in the submarket just sold at a higher cap rate, use that transaction as immediate comp justification for repricing your deal.
Weekly Cap Rate Implications for Portfolio Management and Risk Control

Portfolio-level cap rate movement changes your aggregate valuation and liquidity position faster than individual property performance. A 50-basis-point expansion across a diversified portfolio can erase 8% to 10% of equity value in weeks, even if rents and occupancy stay steady. Track weighted-average cap rates weekly using public REIT proxies for each sector you hold. When the blended rate moves materially, revalue the portfolio and update loan-to-value covenants before lenders do.
Higher cap rates signal higher perceived risk. When cap rates widen, investors are demanding more yield to compensate for uncertainty (depreciation risk, upcoming maintenance, tenant credit concerns, lease rollover timing, regulatory exposure, or systemic spillover from nearby defaults). Use Value at Risk techniques to measure potential monetary loss under stress scenarios, then compare required reserves to current NOI. If a 100-basis-point cap rate expansion would push a property underwater on its loan, increase cash reserves now or consider selling before distress pricing sets in.
Weekly cap rate signals also guide capital allocation. When one sector shows persistent cap rate compression while another expands, rotate capital toward the widening sector if fundamentals support a reversion. For example, if multifamily cap rates widen 30 basis points in a month while industrial holds flat, multifamily may offer better entry pricing for patient capital. But only if rent growth and occupancy trends justify confidence in future NOI.
Using Weekly Cap-Rate Movement to Adjust Reserves and Cash Flow Forecasts
Rising cap rates mean your exit value is falling relative to current NOI, so you need larger reserves to cover potential value shortfalls and maintain debt service coverage. Recalculate required reserves weekly by applying the updated market cap rate to your forward NOI estimate, then compare the implied value to outstanding loan balances. If the gap tightens, set aside additional cash or prepay principal to restore cushion.
Maintenance budgets should flex with cap rate direction. When cap rates expand, buyers will discount deferred maintenance more heavily, so underfunding CapEx now creates a larger haircut at sale. Use weekly cap rate increases as a trigger to accelerate necessary repairs and upgrades. A property sold into a rising cap rate market needs to show institutionally maintained condition to avoid further pricing pressure.
Stress-test cash flow forecasts by modeling cap rate expansion scenarios. If cap rates rise another 50 basis points, what happens to refinancing proceeds, required equity injections, or sale timelines? Run these updates weekly when rate volatility is high. Knowing your breakeven cap rate (where debt service equals NOI and cash flow goes to zero) lets you set clear exit triggers before a position turns distressed.
Interpreting Weekly Cap Rate Signals for Future Market Direction

Cap rate expansion of around 190 basis points across core sectors has driven significant valuation declines. The NCREIF Property Index fell from a peak of 170 in Q4 2022 to roughly 144, a roughly 15% drop. The Green Street Commercial Property Pricing Index declined about 23% peak to trough, from around 154 in 2022 to 119, before posting a 0.7% uptick in May 2024. The first monthly gain after prolonged contraction.
Transaction volume tells the liquidity story. Aggregate CRE sales fell from $589 billion in 2021 to $530 billion in 2022, then collapsed to $244 billion in 2023 (roughly 30% below the prior year and 34% under the trailing 10-year average). Weekly deal flow remains near 10-year lows. When volume stays depressed and cap rates stay elevated, pricing power shifts firmly to buyers, and distressed sellers face limited exit options.
Five forward-looking signals to track weekly:
- Treasury yield direction and magnitude of moves. Sustained climbs above 5% historically precede deeper CRE valuation pressure.
- Public REIT performance by sector. REIT stabilization or rallies often lead private market cap rate compression by several weeks.
- Fund flow data. Net redemptions or resumed inflows signal shifting investor appetite and capital availability.
- Loan maturity walls and refinancing stress. Rising weekly default or extension announcements indicate cap rates may widen further as forced sales increase.
- Rent growth and occupancy trends in your target markets. If NOI starts declining while cap rates expand, valuations face a double hit. If NOI grows while cap rates widen, the net effect on price may be muted.
Final Words
We ran through how to read weekly cap-rate direction despite appraisal lag, the cap-rate math, the main drivers, how different property types react, and quick tactics for buying and portfolio risk control.
Use high-frequency proxies like 10-year Treasury moves, REIT pricing, mortgage-rate shifts, and deal-level yields to infer weekly direction. Rising weekly cap rates usually press prices; falling rates open buying windows.
Focusing on weekly cap rate movement and implications for rental investors helps you tune offers, reserves, and timing. The signals aren’t perfect, but they give a practical edge and real opportunity.
FAQ
Q: What is the 2% rule for rentals?
A: The 2% rule for rentals is a quick screening rule that says monthly rent should equal at least 2% of the purchase price, helping ensure strong cash flow, though it’s rare in many markets.
Q: What cap rate is good for rental property?
A: A good cap rate for rental property is market- and risk-dependent: 4–6% often fits core multifamily, 6–8% suits stabilized single-family, and 8%+ reflects higher-risk or value-add opportunities.
Q: What is the 3 3 3 rule in real estate?
A: The 3 3 3 rule in real estate is a flexible shorthand used differently: agents use it for follow-up (3 contacts, 3 channels, 3 days), while investors sometimes use it as a quick screening guideline.
Q: What is the 7% rule in real estate?
A: The 7% rule in real estate is a screening rule saying annual gross rent should be roughly 7% of purchase price, signaling likely positive cash flow—adjust that target for local costs and financing.