


What if a weekly bump in new listings and a spike in price reductions are the clearest signs that buyers suddenly hold the cards?
When more homes hit the market and sellers start trimming prices, competition eases and motivated sellers show up in the data.
Track those two weekly signals together and you get a live read on negotiating power, and when to push for below-ask offers, inspection credits, or flexible closing terms.
Here’s a short guide to reading the numbers, spotting the two- to three-week windows that matter, and turning raw trends into concrete bargaining moves.
How Weekly New Listings and Price Reductions Signal Buyer Leverage

When weekly new listings climb, buyers gain breathing room. More homes entering the market each week means sellers compete harder for attention, showing slots get easier to book, and multiple-offer bidding pressure drops off. Inventory is the market’s oxygen. When it rises, buyers can breathe again.
A sustained increase in new listings, like the 16 percent year-over-year jump reported for June in many markets, signals that seller leverage is weakening and buyer negotiating power is expanding. Instead of racing to submit offers within 48 hours, buyers can take time to compare homes, request price adjustments, and negotiate inspection credits without fear of immediate competition.
Rising weekly price reductions add another layer of advantage. When price cuts accelerate week over week, sellers are adjusting expectations downward in real time. That tells you their earlier pricing missed the market or demand has cooled. A spike in reductions, especially when 15 to 20 percent of active listings drop their price in a single week, tells buyers that motivated sellers are willing to negotiate. Not just on price but on repairs, closing costs, and timelines.
Price reductions aren’t automatic red flags. They’re signals of market reaction or seller motivation. Recent meaningful cuts (typically 2 to 5 percent) often increase showings and open the door to deeper concessions.
When both metrics rise together, buyers unlock specific negotiation advantages:
More time to decide. Longer decision windows reduce pressure to waive contingencies or rush offers.
Stronger anchoring for below-ask offers. A 3 to 8 percent opening bid below list price becomes defensible when backed by rising reductions and inventory data.
Repair and credit leverage. Sellers facing stiff competition are more likely to agree to inspection credits or pre-close repairs rather than risk losing a serious buyer.
Flexibility on closing timelines. Buyers can negotiate seller-preferred close dates in exchange for modest price concessions (often 0.5 to 1.0 percent).
Lower appraisal risk. Rising inventory and falling prices improve the odds that appraisals support contract prices, reducing the need for gap coverage.
These indicators matter because they compress the window between overconfidence and urgency for sellers. Tracking weekly new listings and price reductions gives buyers a live read on leverage, letting them calibrate offers, timing, and terms to match real market momentum instead of outdated assumptions.
How to Interpret Weekly New Listing Reports

Weekly new listing volume acts as a leading indicator of inventory pressure. When the count of homes added to the market jumps 20 percent or more versus the four-week average, it signals a shift toward buyer-friendly conditions.
Sellers are stepping forward at a faster pace. Either because they believe conditions are still favorable or because they need to move before rates or buyer sentiment deteriorate further. Either way, rising new listings increase choice, reduce urgency, and create competition among sellers. Buyers should expect longer days on market, more showing availability, and greater room to request concessions when this pattern holds for two or three consecutive weeks.
Falling new listing counts tighten the playing field fast. When weekly adds drop 10 to 15 percent below the recent average, inventory shrinks. Showing slots fill quickly, and sellers regain pricing power. In these weeks, buyers face compressed timelines, more aggressive counteroffers, and less flexibility on inspection or financing terms.
The shift can happen abruptly, especially after holiday weeks, rate spikes, or seasonal slowdowns. Tracking the week-over-week percentage change alongside the absolute count helps buyers distinguish short-term noise from durable trends.
Volatility itself carries information. Wild swings in weekly new listings, such as a 25 percent jump one week followed by a 15 percent drop the next, often reflect seasonal quirks, local employment changes, or delayed listing launches. When volatility is high, buyers should average the prior four weeks to smooth out noise and avoid overreacting to a single data point.
Stable, modest increases in new listings over four to six weeks signal a structural shift toward higher inventory and stronger buyer leverage. Stable low counts indicate persistent supply constraints and limited negotiation room.
How to Read Weekly Price Reduction Data

Price reductions track seller confidence in real time. A single week with a sharp uptick in cuts, say, reductions jumping from 8 percent of active listings to 18 percent, indicates that many sellers misjudged demand or that buyer activity cooled faster than expected.
These spikes often precede broader market softening, giving early-moving buyers a chance to negotiate before sellers fully reset expectations. The frequency of reductions matters more than isolated examples. When cuts become routine week after week, the market is repricing downward and buyers can justify offers 3 to 7 percent below current list prices by citing the trend.
Magnitude and repetition reveal motivation. A home that drops price once by 1 percent may be making a cosmetic adjustment to hit a new search bracket. A home that cuts three times in six weeks, each time by 2 to 5 percent, is chasing the market. That signals either overpricing, a must-sell timeline, or weakening comparable sales.
Homes with multiple reductions often yield the deepest concessions because sellers have already demonstrated flexibility and urgency. Timing also matters. Midweek reductions (typically posted on Wednesdays) hit agent alerts and buyer weekend tour plans. Friday or Monday cuts may indicate reactive sellers adjusting after slow weekends.
| Price-Reduction Pattern | What It Indicates for Negotiations |
|---|---|
| Single small reduction (1–2%) within first two weeks | Minor pricing adjustment; limited additional negotiation room; seller testing response. |
| One large reduction (4–7%) after 30+ days on market | Strong signal of motivation or overpricing; expect willingness to negotiate on price, credits, and repairs. |
| Multiple reductions (3+) over 4–8 weeks | High seller urgency or poor initial pricing; significant leverage for below-ask offers and inspection concessions. |
| Weekly reduction spike (15–20% of actives cutting price in one week) | Market softening; broader inventory repricing; buyers should wait 7–14 days for additional cuts or submit aggressive offers backed by trend data. |
Watching the share of active listings with reductions gives context. If 5 percent of listings cut price in a given week, competition remains stiff and concessions will be modest. If that share climbs above 15 percent, the balance tips toward buyers. Sellers who refuse to negotiate risk sitting unsold while comparable homes continue to drop.
Timing Offers Based on Weekly Market Shifts

The best negotiation windows open when weekly new listings rise and price reductions spike simultaneously. Buyers who track both metrics can identify two to three-week stretches where seller competition peaks and motivation climbs.
Submitting offers during these periods, especially 7 to 14 days after a notable reduction spike, lets buyers cite fresh data to justify offers 3 to 7 percent below list. “Price reductions rose 18 percent and active listings increased 22 percent versus the four-week average” gives your below-ask offer a data foundation. Sellers who reduced recently are often more receptive to further concessions because they’ve already acknowledged the market moved against their initial price.
When new listings drop sharply and price reductions fall below 5 percent of inventory, timing flips to urgency. Buyers in these weeks face compressed decision windows, often 48 to 72 hours, and limited room to negotiate repairs or credits.
The optimal move is to act within the first three days of a listing going live. Offer at or slightly above asking, and strengthen terms. Larger earnest money, shorter inspection periods, flexible close dates. Waiting for concessions in a tightening week usually means losing the home to faster buyers or facing a counteroffer above list price.
Mixed signals require patience and selective aggression. If new listings rise but reductions remain low, inventory is growing but sellers haven’t yet adjusted expectations. Wait one to two weeks for cuts to follow. If reductions spike but new listings stay flat, focus offers on the homes that have already cut price rather than chasing stable listings.
Volatile weeks with no clear trend favor caution. Use the four-week moving average to decide whether conditions support aggressive below-ask offers or require competitive positioning.
Negotiation Strategies for Each Market Scenario
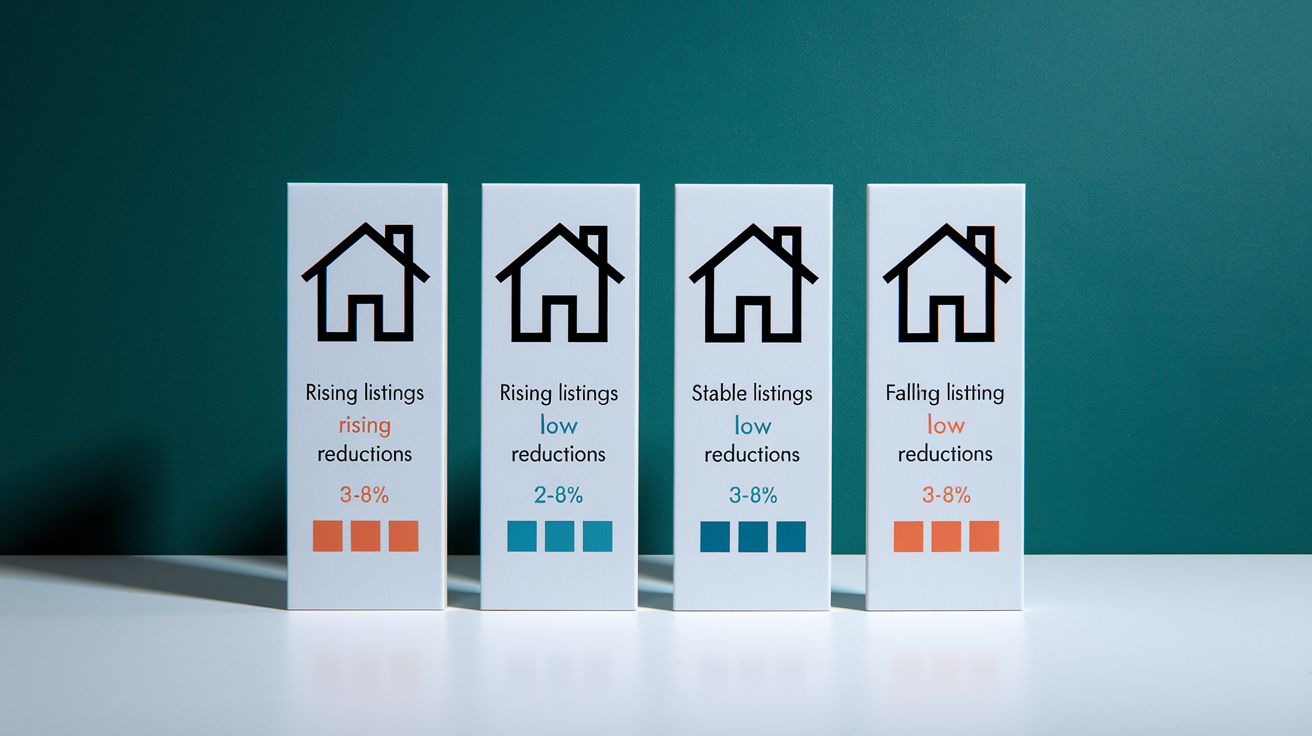
Rising new listings, rising reductions (strong buyer’s market). Start 3 to 8 percent below list price and request seller credits for closing costs or repairs totaling 2 to 5 percent of the purchase price. Example: on a four-hundred-thousand-dollar listing, open at three hundred eighty thousand dollars and ask for eight thousand dollars in closing credits. That nets sixteen thousand dollars in total buyer savings or equivalents.
Rising new listings, stable or low reductions (mild buyer’s market). Offer 1 to 4 percent below list and focus negotiation on inspection credits, extended contingencies, or seller-paid home warranties. Sellers have more inventory competition but haven’t yet cut prices, so frame your offer as helping them avoid a future reduction.
Stable new listings, rising reductions (motivated sellers, balanced inventory). Target listings that have already reduced price at least once. Offer at or slightly below the reduced price and negotiate heavily on repairs, timelines, and appraisal gap coverage. Sellers who cut price without new inventory pressure are often facing personal timelines or financial urgency.
Falling new listings, low reductions (seller’s market). Offer at list price or 1 to 2 percent above. Shorten inspection periods to five to seven days. Increase earnest money from 1 percent to 3 percent, and consider waiving appraisal contingencies up to a modest cap (for example, five thousand dollars). Speed and clean terms win in tight inventory weeks.
Mixed signals or volatile weeks. Pause aggressive offers and monitor for two more weeks. If reductions continue to climb or new listings stabilize upward, shift to buyer-market tactics. If volatility resolves toward tighter inventory, move quickly on preferred properties with competitive terms.
Consecutive weeks of rising reductions without new listing growth. This pattern suggests overpricing across the market rather than demand collapse. Sellers will adjust, but it takes time. Wait 14 to 21 days, then target homes with multiple cuts and offer 4 to 7 percent below current list. Back it with comparable reduction data from the prior month.
Use local weekly stats as bargaining evidence in your offer letter or agent communication. Citing numbers gives your below-ask offer a data foundation and signals you’re informed, not lowballing arbitrarily.
Real-World Examples of Weekly Data Impacting Negotiations

In a Sunbelt metro during late 2025, weekly new listings jumped 22 percent in early March while price reductions spiked from 9 percent of active inventory to 24 percent in a single week. A buyer tracking these shifts waited 10 days, then submitted an offer on a home listed at three hundred ninety-five thousand dollars.
The property had reduced price once by three percent two weeks earlier. The buyer opened at three hundred seventy-five thousand dollars (5 percent below list) and requested six thousand dollars in closing credits. The seller countered at three hundred eighty-two thousand dollars with four thousand dollars in credits. That netted the buyer a total concession of roughly seventeen thousand dollars compared to the original list price.
The weekly spike in reductions gave the buyer confidence to anchor low, and the sustained high new listing count meant the seller faced ongoing competition.
In a Midwest market during January, new listings fell 14 percent week over week after a holiday lull. Price reductions dropped to 3 percent of inventory. A buyer interested in a home listed at two hundred seventy-five thousand dollars submitted an offer at list price within 36 hours of the listing going live. Included a seven-day inspection window instead of the standard ten, and raised earnest money to three percent.
Two other offers came in at the same time. One above asking. The seller accepted the on-time, clean-term offer at full price rather than the higher bid with a longer inspection period. The buyer recognized that falling listings and minimal reductions signaled a seller’s market and adjusted strategy to speed and certainty rather than price negotiation.
During a spring week in a Western metro, new listings rose modestly by 8 percent but price reductions remained flat at 6 percent of actives. A buyer watched for two more weeks as reductions climbed to 11 percent while new listings held steady.
At that point, the buyer targeted a home that had reduced price twice over four weeks, dropping from four hundred ten thousand dollars to three hundred ninety-five thousand dollars. The buyer offered three hundred ninety thousand dollars and requested a credit equal to fifty percent of estimated roof repair costs (approximately forty-five hundred dollars).
The seller, motivated by the two prior cuts and aware of rising local reduction trends, accepted the offer with a four-thousand-dollar credit. The buyer’s patience during mixed signals paid off once the reduction trend confirmed seller flexibility.
Final Words
In the action, rising weekly new listings and upticks in price reductions shift leverage toward buyers.
We showed how to read weekly listings, spot price‑cut patterns, time offers, and pick tactics for different scenarios.
When both metrics climb, buyers get more time, bargaining room, and clearer paths to concessions — so tweak offer strength and ask for repairs or credits.
Use this as a simple checklist for what weekly new listings and price reductions indicate for negotiations — watch the weekly data and you’ll be negotiating from strength.
FAQ
Q: What is the 3-3-3 rule in real estate?
A: The 3-3-3 rule in real estate is a practical pricing rule of thumb: list, watch for three weeks, apply about a 3% price reduction if traffic’s weak, then reassess after another three weeks.
Q: What is the best day to do a price reduction on a house?
A: The best day to do a price reduction on a house is early in the week—Monday or Tuesday—to maximize MLS exposure ahead of weekend showings and give agents time to market the new price.
Q: What is the hardest month to sell a house?
A: The hardest month to sell a house is typically December, when holidays and cold weather cut buyer activity; generally December through February are the slowest months in many markets.
Q: Is there going to be a housing crash in 2026?
A: Whether there will be a housing crash in 2026 is uncertain; current signals are mixed—watch mortgage rates, inventory trends, employment, and rising price reductions to judge risk for your local market.