

What if the new apartments everyone cheered are quietly cooling rents?
New apartment completions often slow or even push down rent growth, especially near deliveries and in metros that built a lot.
This piece shows what happened, what’s driving it, and what it means for renters, owners, and investors.
You’ll see the distance effect: units closest to new buildings take the biggest hit, the vacancy and filtering mechanics, and the metro-level differences tied to how much was delivered.
Read on to know what to watch next.
Immediate Market Effects of New Apartment Completions on Rent Growth

Rental prices drop when supply grows faster than demand. Pretty straightforward. Each new unit hitting the market competes for renters, and when that competition shows up all at once, rents adjust down or slow their climb. A study tracking 1,100 newly finished apartment buildings across 11 U.S. cities found that rents for older units closest to each new project fell compared to units farther out in the year after delivery. That’s about as clear as it gets: more apartments nearby, lower rents nearby.
The national picture tells the same story. Around 600,000 multifamily units got delivered in 2024—the biggest annual haul since 1974—and metros with the heaviest building saw the weakest rent growth. Austin added new units equal to nearly 10 percent of what it already had since 2020 and watched rents drop roughly 3 percent year over year. Hartford built almost nothing, less than 1 percent new stock, and saw rents jump more than 8 percent in the same window. That gap shows up across the top 50 rental markets: the link between construction share and rent growth clocks in at −0.78, the tightest relationship among 487 tested variables.
Four things happen consistently when new apartments finish in volume:
- Rent softening near new projects – units within 300 meters of a new building see smaller increases or outright drops compared to units farther away.
- Vacancy climbing – new supply means more choices, which pushes vacancy up and gives renters leverage.
- Downward pull on asking rent – landlords in older buildings cut prices or throw in concessions to compete with shiny new amenities.
- Slower leasing – days on market stretch for existing units as renters check out the new stuff first.
The 2024 wave started with projects that broke ground in 2022, when money was cheap and optimism ran hot. Two year timelines mean today’s deliveries reflect yesterday’s bets. Markets that greenlit the most permits in 2022 are dealing with the overhang now, and the ones that kept things tight are watching rents run unchecked. The takeaway is simple: when supply lands, rents respond. Usually within a year, usually downward in the zones closest to the new inventory.
Economic Mechanisms Connecting Apartment Construction and Rent Growth Trends

Housing supply and demand work like any other market. When quantity rises and willingness to pay holds flat, price growth slows or flips. The mechanism starts at groundbreaking, not the ribbon cutting. Projects take roughly two years from start to finish, so a permit rush in one year becomes a delivery wave two years out. That lag is why 2024’s record completions trace back to 2022’s construction boom, and why forecasting rent growth means watching pipeline data instead of just what opened last month.
Filtering makes it bigger. New Class A buildings pull renters from Class B stock, which then fights harder for tenants and pushes B rents down. Class B renters facing lower prices or better deals move up from Class C inventory, and C rents follow. Filtering only kicks in when construction volume is big enough to set off those chains. One new building won’t budge the needle, but a hundred will. In high supply metros, that cascading pressure drove Class C rents down 6 percent or more, even while Class A units filled fast. In low supply metros, no cascade happens because there’s nothing new to pull renters up, so Class C rents climb as the only option left for demand.
| Mechanism | Effect on Rent | Time Horizon |
|---|---|---|
| Supply expansion | Direct downward pressure on asking rents and concessions increase | 0–12 months |
| Filtering (A→B→C) | Cascading rent reductions across lower-tier inventory | 6–24 months |
| Vacancy chain effects | Rising vacancy rates reduce landlord pricing power | 3–18 months |
| Absorption dynamics | Slow absorption extends rent softness; fast absorption shortens it | 12–36 months |
Absorption rates decide how long the hurt lasts. If new units lease up quick because job growth is strong or migration is heavy, rents stabilize sooner. If absorption drags, vacancy stays high and rents stay soft for years. The link between new construction share and rent growth (−0.78 across the top 50 metros) confirms that supply matters more than almost anything else, but the time it takes for supply to clear decides whether you’re looking at a dip or a multi year trough.
Geographic Variations in Rent Growth Caused by New Apartment Deliveries

Not every city handles a supply wave the same way. Florida metros took the worst hit: Fort Myers, Sarasota, and Daytona Beach each posted Class C rent drops of 10 to 12 percent year over year, pushed by oversupply in markets that surged during the pandemic migration rush. Orlando, Jacksonville, and Tampa saw smaller but still real Class C declines of 4 to 5 percent. Developers raced to meet what looked like lasting demand, but household formation slowed, insurance costs spiked, and renters hit affordability walls. Supply outran the buyer pool.
Sunbelt metros tell a similar story. Austin, Phoenix, Salt Lake City, Atlanta, and Raleigh/Durham all recorded Class C rent drops of at least 6 percent, each sitting well above the national average for new construction as a share of total stock. These are fast growth metros where population gains justified aggressive pipelines in 2021 and 2022, but the two year lag meant deliveries showed up after migration had cooled and financing got tighter for renters. Job growth stayed positive in most of these markets, but it wasn’t enough to soak up the volume coming online.
Low supply metros enjoyed strong rent growth. Of the 150 largest U.S. rental markets, 18 saw Class C rent jumps above 5 percent, and nearly all had minimal new development:
- Midland/Odessa, Texas – energy sector job growth and almost no multifamily construction kept rents climbing.
- Knoxville, Tennessee – steady in migration and regulatory limits on new supply pushed rents up across all classes.
- Grand Rapids, Michigan – household formation outpaced completions; vacancy stayed near record lows.
- Cincinnati, Ohio – modest population growth but even less building activity meant tight inventory.
- Chicago, Illinois – select submarkets saw rent gains despite citywide sluggishness, driven by neighborhood level supply shortages.
Migration flows and household formation shape how each metro absorbs new supply. Austin’s in migration slowed hard after 2022, leaving a glut of new units chasing fewer new renters. Knoxville’s migration stayed steady but construction stayed minimal, so every new household fought over the same limited stock. Job growth alone doesn’t predict rent outcomes. It’s the gap between how many people arrive and how many units get built that sets the direction. When construction outpaces household formation, rents fall. When household formation outpaces construction, rents rise. The metros in the middle see modest moves either way, and those are hardest to forecast without tracking pipeline data month by month.
Distance-Based Rent Effects of New Apartment Construction

Proximity matters. The 11 city study measured rents by distance in meters from each new building, and the pattern was obvious: before construction, rents typically fell the farther you moved from the planned site, probably because developers targeted higher value locations. After construction, that flipped. Rents closest to the new building dropped relative to units farther out, creating an upward sloping rent curve with distance. If you owned a rental 100 meters from a new luxury tower, your asking rent took a bigger hit than your neighbor 500 meters away.
The reversal happens because new supply competes most directly with the nearest options. A renter comparing a new Class A unit to an older Class B walk up will tour both if they’re on the same block. When the new building offers better finishes, in unit laundry, a gym, and a concierge, the older landlord either cuts rent or watches days on market stretch. Units farther away face less direct competition. Renters pick neighborhood first, then drill down to specific buildings, so a new tower three blocks north doesn’t pull as many prospects from inventory six blocks south.
Key changes in rent patterns before and after construction:
- Pre construction – rents dropped with distance from the future building site, reflecting site selection in higher rent zones.
- Post construction – rents climbed with distance, meaning the closest existing units took the largest relative hits.
- Magnitude – the study focused on market rate and luxury projects in gentrifying neighborhoods, where the competitive effect is most visible.
For investors, the lesson is granular: neighborhood level supply forecasts aren’t enough. Track which blocks are getting new inventory, measure your asset’s distance from those projects, and adjust numbers accordingly. A building 200 meters from a new completion should model rent growth at least 2 to 4 percentage points lower than a comparable asset 600 meters away, assuming similar vintage and amenities. The effect fades with distance, but it’s real and predictable when you know where the cranes are.
Filtering Effects and Class-Tier Rent Adjustments Following Completions
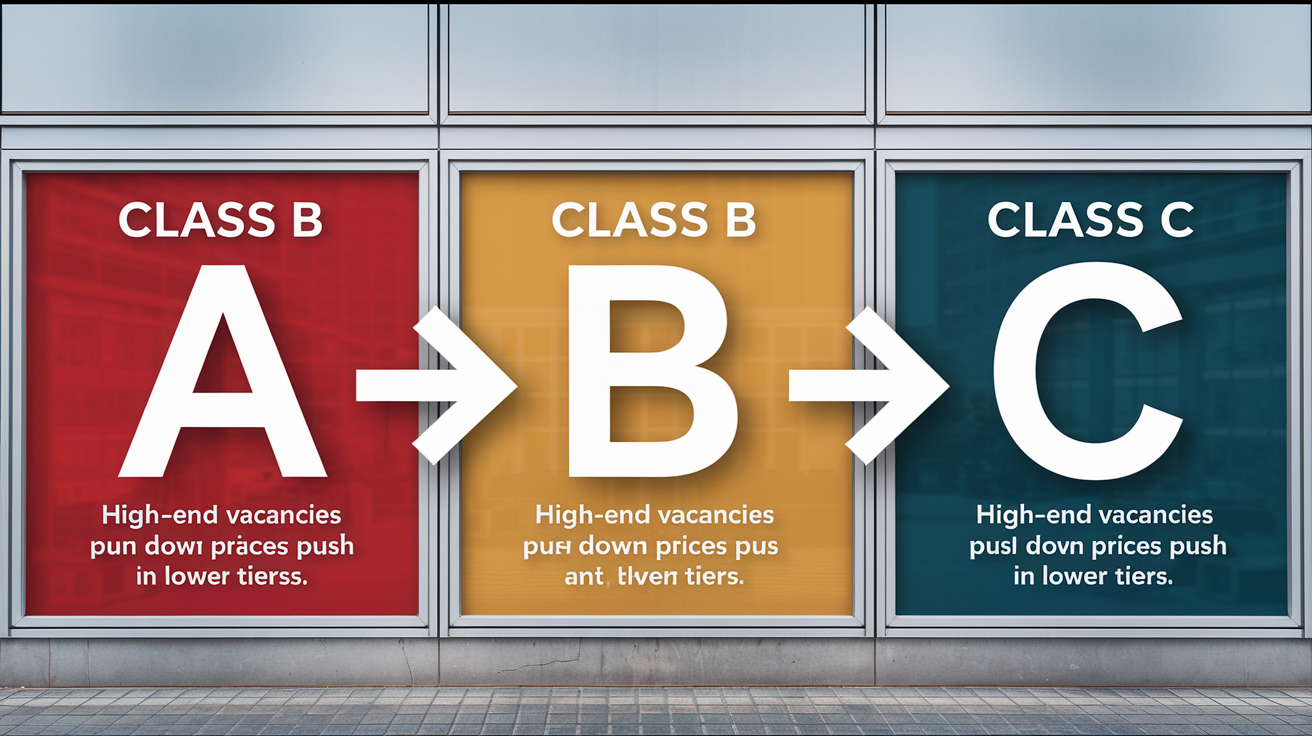
Filtering is how new luxury apartments push rents down in older, lower tier inventory. It works through tenant movement: a new Class A building opens with high end finishes and amenities. Renters in aging Class B units who can afford the upgrade or want the better product move into the new stock. That creates vacancy in Class B, forcing those landlords to drop rents or offer concessions to backfill. Renters in Class C units, facing lower B prices, upgrade into the now cheaper B inventory, which pushes down on Class C asking rents. The chain only fires up when construction volume is big enough to pull a meaningful chunk of the renter base upward.
In markets where new apartment construction topped the national average, Class C rents fell at least 6 percent year over year in 12 metros. The steepest drops, 10 to 12 percent in Fort Myers, Sarasota, and Daytona Beach, happened where Class A supply surged and filtering cascaded through the entire stock. Austin, Phoenix, Salt Lake City, Atlanta, and Raleigh/Durham saw similar moves, though the size varied with absorption rates and migration trends. The common thread: enough new Class A units to pull Class B renters, creating a vacancy wave that rippled down to Class C.
The 18 low supply metros that recorded Class C rent growth above 5 percent built almost nothing new, so filtering never started. Without new A class inventory to absorb upwardly mobile renters, Class B stayed tight, and Class C had nowhere to relieve pressure. That’s why Midland/Odessa, Knoxville, Grand Rapids, Cincinnati, and Chicago, all minimal construction markets, saw rent increases across all tiers. Filtering needs volume; one or two new buildings won’t trigger the chain, but a pipeline delivering hundreds of units per quarter will.
Filtering Chain Breakdown
The sequence moves in stages. In the first six months after a wave of Class A completions, B to A migration picks up as renters tour new units and lease up the best ones. Class B vacancy ticks up, and landlords respond by dropping asking rents or adding a month of free rent to close deals. Over the next six to twelve months, renters in Class C properties who were previously priced out of B stock notice the new gap and upgrade, leaving C units vacant or forcing C landlords to cut rents to compete.
Affordability improves most when construction volume is high and sustained. A single year of heavy deliveries can trigger filtering, but if the pipeline dries up right after, the effect fades as demand catches up. Markets that keep steady, above average construction over multiple years see the deepest and most lasting filtering effects, which is why policy discussions increasingly focus on removing barriers that slow permitting and boosting the volume of all housing types, not just luxury. Luxury projects may be the only option that pencils for developers facing rising land, labor, and materials costs, but those projects still deliver filtering benefits to lower income renters when built at scale.
Time-Lag Effects Between Construction Waves and Rent Growth Cycles
Most of the apartments that delivered in 2024 broke ground in 2022, when interest rates were near zero and pandemic era migration had developers betting on sustained demand. That two year gap between start and finish is the industry standard, and it’s why today’s rent outcomes reflect yesterday’s capital decisions. Metros that approved the most permits in 2021 and 2022 are absorbing the biggest supply shocks now, while metros that kept permits tight, either by choice or regulatory constraint, are watching rents accelerate as household formation outpaces completions.
Completions are expected to slow in 2025 and 2026 as the pipeline built in 2022 clears and fewer projects break ground under today’s higher financing costs. That slowdown should support faster rent growth in markets where demand stays stable or growing, because the gap between household formation and new supply will narrow. Markets that currently sit above the population based trendline, meaning construction outpaced recent population growth, will see the sharpest rebound as absorption catches up and vacancy rates normalize.
| Lag Window | Expected Rent Response | Vacancy Movement |
|---|---|---|
| 6 months | Modest downward pressure; concessions begin | Vacancy rises as new units lease up and older stock competes |
| 12 months | Peak rent softness; asking rents decline or flatten | Vacancy peaks if absorption is slow; stabilizes if demand is strong |
| 24 months | Rent recovery begins if no new wave arrives; growth resumes | Vacancy declines as backfill completes and pipeline slows |
Short term volatility is normal when construction waves hit. A metro can swing from rising rents to falling rents within twelve months if a big batch of projects completes at once. That’s why tracking pipeline data, units under construction, units permitted but not started, and historical permit trends, is more predictive than backward looking rent comps. If you see a metro with 10,000 units delivering this year and only 2,000 permitted for next year, you can forecast that rent pressure will ease in 12 to 18 months, assuming demand stays constant. If permits stay high, expect continued softness until absorption catches up or migration accelerates.
Moderating Factors That Influence the Rent Impact of New Supply

Job growth can outweigh supply shocks. A metro adding 50,000 jobs per year can absorb 10,000 new apartment units without breaking a sweat, because household formation follows employment. A metro losing jobs or seeing flat wage growth will struggle to fill new inventory even if migration stays positive, because renters can’t afford the asking prices. Austin’s tech sector slowdown in 2023 and 2024 meant fewer high income renters arriving just as thousands of new luxury units hit the market, making the rent decline worse than what supply alone would predict.
Migration trends matter as much as raw population growth. A metro can grow slowly but see strong rental demand if the new arrivals are young, single, or early career workers who rent by default. A metro can grow quickly but see weak rental demand if the new arrivals are families buying homes in the suburbs. Florida’s post pandemic boom attracted retirees and remote workers, many of whom bought rather than rented, which left the new apartment inventory competing for a smaller than expected renter pool.
Vacancy and absorption rates are real time demand signals. If new units lease up in 60 days and stabilize at 95 percent occupancy, supply isn’t the problem. Rents can hold or grow. If units sit vacant for six months and need two months of free rent to close deals, supply is outrunning demand and rents will fall. Landlords adjust pricing based on how long inventory sits; a building that leases 80 percent of units in the first quarter will hold firm on rents, while a building at 40 percent after six months will cut asking prices and pile on concessions.
Five variables investors and managers should track:
- Net job creation – monthly employment reports by metro and sector, focused on wage levels and industry mix.
- Net migration flows – U Haul rates, IRS migration data, and local utility connection counts as proxies for household moves.
- Vacancy rates by class – separate A, B, and C tracking to spot where pressure is building or easing.
- Absorption velocity – days from delivery to stabilized occupancy for new projects, compared with historical norms.
- Regulatory and cost environment – permit approval timelines, impact fees, property tax changes, and construction cost indices that shape future pipeline decisions.
Construction cost structures and regulatory friction also shape outcomes. Rising land prices, labor shortages, material inflation, and climbing taxes push developers toward luxury projects because those are the only deals that work under high costs. A $300,000 per unit project can support Class A rents but not Class C rents, so supply concentrates at the top even when demand is strongest at the bottom. Filtering helps, but only if volume is high enough. Regulatory barriers like zoning restrictions, lengthy permitting, and impact fees cut total supply and push costs higher, which explains why low supply metros often have the tightest regulations and the fastest rent growth.
Forecasting Rent Growth Using Completion Rates and Pipeline Data

The strongest single predictor of near term rent growth is the share of housing stock built in the past few years. The link between that variable and rent growth across the top 50 U.S. rental markets is −0.78, meaning metros with the most new construction see the slowest rent growth, and vice versa. That relationship holds even when you control for population growth, job growth, and migration, because supply is the thing that directly changes the number of available units renters can pick from.
Pipeline data, units currently under construction plus units permitted but not yet started, gives you a 12 to 24 month forward view of supply. If a metro has 8,000 units under construction today and typical completion timelines are 18 months, expect those units to hit the market in mid 2026. If permits are down 40 percent year over year, expect fewer starts in 2025 and fewer completions in 2027. Combining pipeline counts with absorption trends and vacancy rates lets you model whether supply will outpace or lag demand at specific future dates.
Forecasts currently expect fewer completions in 2025 and 2026 compared with the 2024 peak, which should support faster rent growth nationally if household formation stays steady or picks up. Metros that overbuilt in 2022 through 2024 will see the sharpest rebound as pipelines thin out and vacancy normalizes. Metros that underbuilt will see continued upward pressure on rents unless migration slows or job growth stalls.
Core Inputs for Predictive Rent Modeling
Completion pipelines are the foundation. Track units under construction, units permitted, and average time to delivery by metro. Pair that with absorption curves: how quickly have similar projects leased up historically, and is that pace speeding up or slowing down? Layer in job growth data from the Bureau of Labor Statistics, filtered by sector to spot whether new employment is concentrated in high wage industries that support Class A rents or lower wage sectors that drive Class C demand.
Migration data finishes the picture. IRS county to county migration files, moving truck demand indices, and state level population estimates show whether people are arriving or leaving. Combine inflows with household formation rates, new renters per 1,000 new residents, to estimate how many units the market can absorb per quarter. When projected completions exceed projected absorption, model rent growth at or below inflation. When projected absorption exceeds completions, model rent growth above inflation and tightening vacancy.
Four metrics for every rent forecast:
- Pipeline unit count – total units under construction and permitted, updated quarterly.
- Historical absorption rate – average months to stabilized occupancy for comparable new projects over the past 24 months.
- Job growth trajectory – monthly employment change and wage growth by metro, annualized and sector adjusted.
- Net migration estimate – quarterly population change minus natural increase, converted to household formation using local averages.
Models that skip supply pipelines will consistently overshoot or undershoot actual rent outcomes, because backward looking comps can’t capture the impact of new inventory that hasn’t delivered yet. A metro with flat rents today but 5,000 units delivering next quarter will see rents fall unless demand surges unexpectedly. A metro with rising rents today but zero new projects in the pipeline will see rents accelerate unless migration reverses. Forecasting is just math: units coming versus households forming, updated every quarter as new data lands.
Final Words
New apartment completions shift rent dynamics fast and unevenly across metros, price tiers, and even city blocks.
Supply matters most when it outpaces job growth and household formation. Markets like Austin and Phoenix saw the clearest proof in 2024.
The impact of new apartment completions on rent growth shows up in the data within six to twelve months, particularly in Class C units where filtering effects hit hardest.
Tracking construction pipelines, absorption rates, and distance-based rent changes gives buyers, investors, and pros a clearer read on where affordability is heading next.
FAQ
Q: How do new apartment completions affect short-term rent growth?
A: New apartment completions affect short-term rent growth by increasing local supply, which usually moderates nearby rents, raises vacancy, and slows asking-rent gains within about 6–12 months.
Q: What did the 11-city, 1,100-building study find about distance-based rent effects?
A: The 11-city, 1,100-building study found distance-based rent effects reversed after delivery: rents within roughly 0–300 meters fell relative to farther units, showing clear, localized downward pressure one year post-completion.
Q: How did the 2024 national surge of 600,000 completions influence metro rent patterns?
A: The 2024 surge of 600,000 completions coincided with slower rent growth in high-construction metros (Austin, Phoenix) and stronger rent growth in low-supply metros (Midland/Odessa, Knoxville, Grand Rapids).
Q: How does the construction timeline create lagged rent responses?
A: The construction timeline creates lagged rent responses because most projects take about two years to deliver; rent impacts commonly appear on 6-, 12-, and 24-month horizons after major delivery waves.
Q: What is filtering and how does new Class A supply change Class B and C rents?
A: Filtering is when new Class A units attract higher-income tenants, displacing renters down to Class B and C; this cascade can reduce B and C rents, especially after substantial new-supply waves.
Q: Which metros showed the biggest supply-driven rent declines or growth in recent data?
A: Recent data showed Class C declines of 10–12% in Fort Myers, Sarasota, Daytona Beach; ≥6% declines in Austin, Phoenix, Salt Lake City, Atlanta, Raleigh; growth in Midland/Odessa, Knoxville, Grand Rapids, Cincinnati, Chicago.
Q: What moderating factors determine whether new supply will lower rents in a metro?
A: Moderating factors determining rent impact include job growth, migration flows, vacancy levels, regulatory and construction costs, and absorption speed; strong demand can offset even large supply increases.
Q: How should investors and analysts use completion and pipeline data to forecast rent growth?
A: Investors should use completion shares, pipeline units, absorption rates, job and migration trends, and vacancy trajectories—these inputs, plus the −0.78 correlation between construction and rents, guide forward rent projections.