

What if a Fed rate cut can raise a property’s value by 20% with no rent change?
When the Fed cuts, borrowing gets cheaper and Treasury yields usually fall, and that tends to push multifamily cap rates down.
Lower cap rates mean buyers pay more for the same net operating income.
That can produce quick, valuation-heavy gains.
It’s mostly mechanical, but not guaranteed: risk spreads, local rents, and lender behavior can mute or reverse the effect.
This piece explains how cuts transmit to cap‑rate moves, who benefits, and the key signals to watch next.
Core Relationship Between Fed Rate Cuts and Multifamily Cap Rates

When the Fed cuts rates, borrowing gets cheaper. And that compresses multifamily cap rates pretty quickly. The logic is straightforward: lower federal funds rates mean cheaper mortgages and commercial debt, so investors can pay more for the same income stream. In September 2024, the Fed dropped rates by 50 basis points, then another 25 in November, landing at 4.50 to 4.75 percent. Those cuts brought down financing costs fast and signaled that monetary policy was loosening, which put immediate downward pressure on required yields across commercial real estate.
Cheaper debt lets investors accept lower returns on equity because their cost of capital just fell. Multifamily properties compete with other income assets, so when risk-free Treasury yields drop alongside Fed cuts, the spread premium investors want above Treasuries shrinks. Lower borrowing costs also boost leverage capacity and improve transaction liquidity, ramping up buyer competition. More buyers chasing the same inventory drives prices higher. Since cap rate equals net operating income divided by price, rising prices compress cap rates when NOI stays flat.
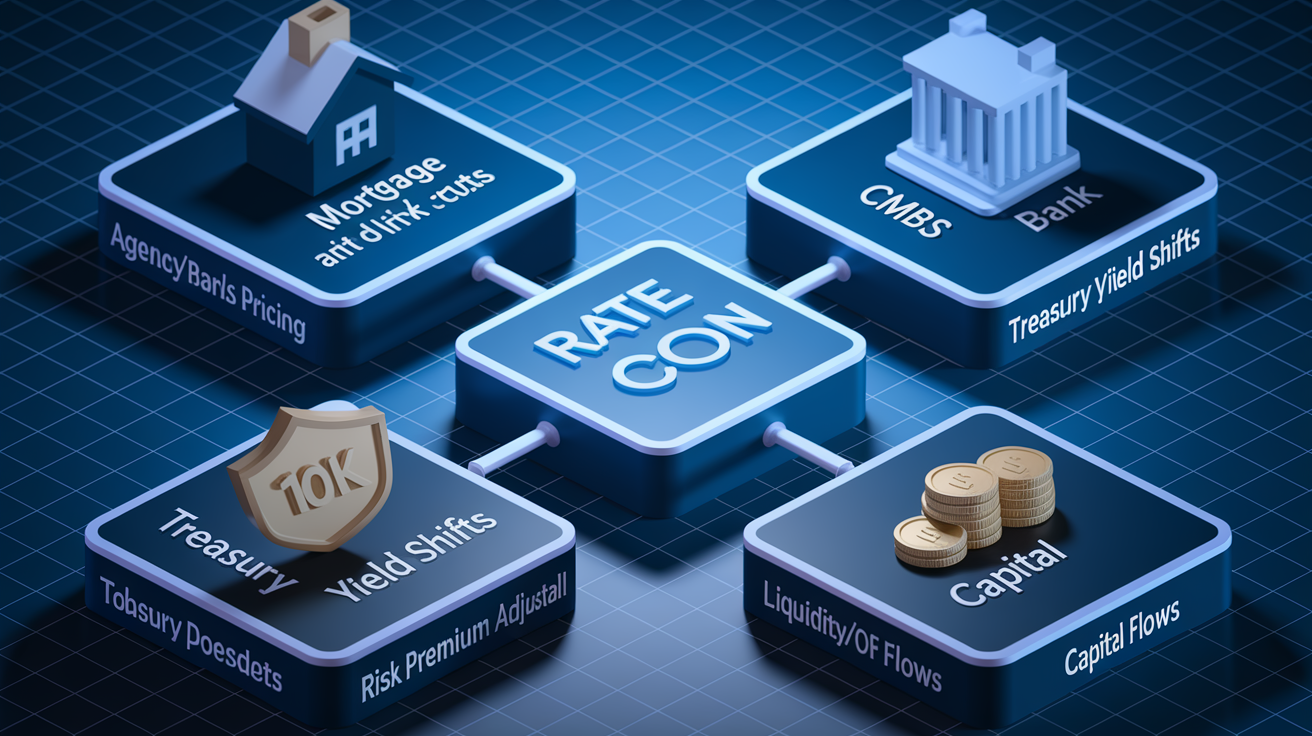
Five things shape how fast Fed cuts hit cap rates:
- Borrowing costs: Agency debt, bank loans, and CMBS pricing all drop when the Fed lowers short-term rates.
- Investor yield requirements: Lower Treasury yields reduce the baseline return investors need, tightening spreads.
- Treasury yield spreads: Cap rates track the 10-year Treasury plus a risk premium, so if Treasuries fall, cap rates usually follow.
- Buyer competition: Lower financing costs pull more capital into multifamily, pushing bid prices up.
- Market liquidity: Rate cuts encourage refinancing and unlock capital flows, boosting transaction volume and price discovery.
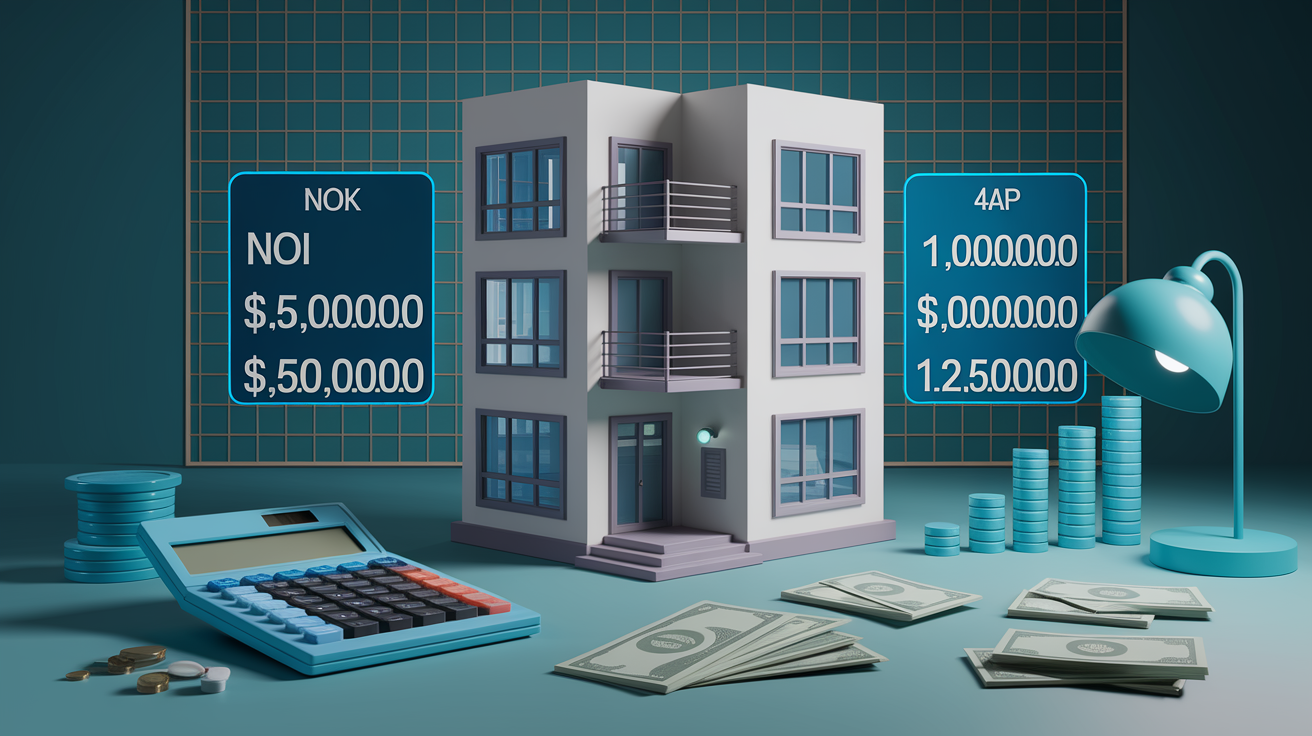
A property generating $500,000 in NOI at a 5.0 percent cap rate is worth $10,000,000. If the cap rate compresses to 4.0 percent, that same NOI lifts the valuation to $12,500,000. That’s a $2.5 million gain, or 25 percent, with zero change in operations. This sensitivity to small cap rate moves is why Fed policy matters so much. A 100 basis point cap rate shift can swing valuations by 20 to 25 percent, making rate changes a major pricing driver even when fundamentals don’t budge.
How Interest Rate Policy Transmits Into Multifamily Cap Rate Movement
Agency lenders, banks, and CMBS markets price multifamily debt by adding a spread over a benchmark rate, usually tied to Treasury yields or the secured overnight financing rate. When the Fed announces a cut, short-term rates drop first. Mortgage pricing adjusts within weeks as lenders reprice risk and reset underwriting. CMBS spreads can widen or narrow depending on investor risk appetite. During stress, spreads may widen even if the policy rate falls, which mutes cap rate compression. Banks tend to move faster than life companies or agency lenders because their funding costs adjust more immediately with Fed moves. Recent shifts show 50 to 100 basis points in lending rates appearing within weeks of major Fed announcements, though final pricing depends on credit quality, loan to value, and market conditions.
Short-term Treasury yields react quickly to Fed guidance, often moving on forward expectations before the actual cut. The 10-year Treasury yield, a common benchmark for commercial real estate discount rates, adjusts more slowly. It reflects inflation expectations, growth outlook, and risk sentiment alongside policy. When the Fed cuts, the 10-year may fall by less than the policy rate if inflation remains sticky or investors expect future hikes. Risk premiums above Treasury yields can expand or contract based on economic stress, creating variability in how cap rates respond. If risk premiums widen during a recession while Treasury yields fall, cap rates may rise even as borrowing costs decline. That disconnect happened in 2008 and can repeat when macro conditions create fear.
| Transmission Channel | Effect on Multifamily Cap Rates |
|---|---|
| Agency/bank/CMBS pricing | Immediate reduction in loan rates and debt service costs, raising property values and compressing cap rates as buyers can pay more with lower monthly debt payments. |
| Treasury yield shifts | 10-year Treasury decline lowers the risk-free benchmark, reducing required equity returns and pushing cap rates down when spreads remain stable. |
| Risk premium adjustments | If investor confidence rises, risk spreads narrow and cap rates compress further. If macro stress increases, spreads can widen and offset policy rate relief. |
| Liquidity/capital flow changes | Lower rates unlock refinancing and attract investor capital, increasing transaction volume and buyer competition, which compresses cap rates through higher bid prices. |
Multifamily Valuation Mechanics When Rates Shift
The direct capitalization formula is simple: property value equals net operating income divided by the cap rate. When a Fed rate cut compresses the cap rate by even 25 basis points, the denominator shrinks and the value rises, assuming NOI stays constant. Sensitivity increases as cap rates fall. Moving from 5.0 percent to 4.75 percent creates a larger percentage price jump than moving from 7.0 percent to 6.75 percent, because the same absolute change has more impact at lower starting rates. A property with stable NOI can see a 5 to 10 percent valuation swing from a modest 25 basis point cap rate compression, and a full 100 basis point drop can push values up 20 to 25 percent.
NOI stability matters because cap rate compression only translates into value gains if operating income holds or grows. If lower rates coincide with rising vacancy, falling rents, or higher operating expenses, NOI can decline and partially or fully offset the benefit of a lower cap rate. Investors need to model both the numerator and denominator: cheaper debt helps, but if fundamentals weaken, values may stagnate or fall even as financing costs improve. The interplay between income and discount rate is where many underwriting mistakes happen during rate cut cycles.
Four valuation inputs directly affected by Fed cuts:
- Net operating income: Rate cuts can stimulate job growth and household formation, supporting rent growth and occupancy. But slower economic activity during a recession can reduce demand and pressure NOI.
- Discount rate: Lower policy rates reduce the cost of equity and debt, lowering the overall weighted average cost of capital and compressing the cap rate applied to NOI.
- Exit cap rate: Assumptions about future sale pricing shift when rate expectations change. Buyers model lower exit cap rates if they expect continued monetary easing.
- Risk premium: Fed cuts during stable conditions compress spreads. Cuts during crises can widen them if investors flee to safety and demand higher yields for commercial risk.
Historical Patterns Linking Fed Moves and Multifamily Cap Rates

Between June 2004 and June 2006, the Federal Reserve raised the federal funds rate by 400 basis points, moving from 1.25 percent to 5.25 percent. National multifamily cap rates fell 90 basis points during the same period, dropping from 7.2 percent to 6.3 percent. Strong rent growth, low vacancy, and robust demand for multifamily assets overwhelmed the rate hike pressure, proving that cap rates don’t always move in lockstep with Fed policy. Investors accepted lower yields because operating fundamentals improved faster than borrowing costs rose, and risk appetite remained high throughout the mid-2000s expansion.
From 2022 through early 2024, the Fed hiked rates aggressively to combat inflation near 8 percent in 2022. National multifamily cap rates increased 83 basis points between 2022 and 2023, followed by an additional 29 basis points by March 15, 2024. Regional variation ranged from 85 basis points in the Midwest to 112 basis points in the Northeast. The rapid tightening compressed investor risk appetite, widened credit spreads, and raised financing costs faster than NOI could adjust. New supply hitting the market in 2023 and 2024 further pressured rents and occupancy, reinforcing cap rate expansion even as some investors anticipated eventual rate cuts.
Investors must consider multiple factors beyond Fed moves because cap rate behavior depends on supply, demand, local job growth, construction activity, operating cost inflation, and risk sentiment. The 2004 to 2006 and 2022 to 2024 examples show that strong fundamentals can override rate hikes and weak fundamentals can override rate cuts. Policy is one input, not the only input. Treating Fed announcements as a standalone cap rate predictor leads to mispriced deals and underwriting errors.
Timing Lags Between Fed Rate Cuts and Cap Rate Compression

Debt pricing shifts within weeks of a Fed cut as lenders reprice loan applications and adjust rate sheets. Refinancing windows open immediately for borrowers with floating rate debt or loans maturing into a lower rate environment, improving cash flow and increasing property values on a cash-on-cash basis. Transaction based cap rate compression takes longer, typically three to twelve months, because sellers need time to reset price expectations, buyers need time to underwrite new assumptions, and appraisers wait for closed sales to confirm value changes. Full market repricing often requires twelve to twenty-four months as transaction volume builds and comparable sales reflect the new pricing environment.
Delayed impacts include seller holdouts who anchor to prior valuations and resist price cuts, legacy fixed rate debt that allows owners to avoid refinancing at higher rates and delay selling, and slower appraisal adjustments as comparable sales data lags real-time market shifts. Buyers may initially underbid until distressed sellers or motivated institutional portfolios establish new pricing benchmarks, creating a standoff that extends the lag between policy change and observable cap rate compression in transaction data.
Five primary sources of cap rate lag after a Fed cut:
- Seller price anchoring: Owners who bought at lower cap rates resist accepting compressed values until distress or opportunity cost forces a sale.
- Fixed rate legacy debt: Properties financed at sub-4 percent rates before 2022 face no immediate refinancing pressure, reducing the urgency to transact and slowing price discovery.
- Appraisal conservatism: Valuation professionals wait for closed sales to confirm cap rate shifts, creating a 90 to 180 day data lag in official valuations.
- Underwriting caution: Buyers stress test deals and delay closing until they see sustained NOI stability and cap rate trends, extending negotiation cycles.
- Market liquidity friction: Lower transaction volume reduces the number of data points available to establish new cap rate benchmarks, slowing the feedback loop.
Market Conditions That Can Override Fed Driven Cap Rate Effects

Rising multifamily supply in 2023 and 2024 delivered new units faster than household formation could absorb them, lifting vacancy rates and limiting rent growth in many metros. When new inventory floods the market, NOI growth stalls or reverses, pushing cap rates higher even if borrowing costs fall. Operating expenses also rose during this period. Insurance, property taxes, utilities, and payroll all increased faster than rents in some submarkets, compressing net operating income and forcing investors to demand higher yields to compensate for margin pressure. Local fundamentals can easily overwhelm the impact of a 25 or 50 basis point Fed cut when supply-demand imbalances or cost inflation hit hard.
Regional variation between 2022 and 2023 ranged from 85 basis points in the Midwest to 112 basis points in the Northeast, showing that national averages mask wide differences in market performance. Sunbelt metros with heavy construction pipelines saw larger cap rate increases than slower growth Midwest markets with limited new supply. Migration patterns, job growth, wage inflation, and local regulatory environments all influence how quickly cap rates respond to Fed moves. An investor buying in a high supply, low rent growth market should expect minimal cap rate compression from a Fed cut, while a buyer in a supply constrained, high demand market may see faster and larger cap rate tightening.
Investor Strategy Adjustments During a Fed Rate Cut Cycle

Lower rates increase buyer competition as more capital flows into multifamily, compressing cap rates and pushing prices higher. Investors often respond by moving down the quality curve, targeting value add deals, secondary markets, or higher leverage structures to maintain return targets when core assets price at sub-4 percent cap rates. Underwriting should model 50 to 200 basis point cap rate shifts in both directions, stress testing acquisition prices and exit assumptions to measure downside risk. Investors who lock in low rate debt at the start of a cut cycle gain a financing advantage, but those who overpay during a compression phase face refinancing risk if rates reverse or fundamentals weaken. What Does a Fed Rate Cut Mean for Multifamily Real Estate?
Selling and refinancing timing matter because rate cut windows create liquidity and buyer appetite. Sellers can capture higher prices during cap rate compression if they time the exit before supply or economic slowdowns reverse the trend. Refinancing becomes attractive when the spread between existing loan rates and new market rates justifies prepayment penalties or yield maintenance costs. A 50 to 100 basis point drop in financing costs can reduce monthly debt service enough to boost cash flow by 10 to 20 percent. Owners with floating rate debt benefit immediately, while fixed rate holders must wait for maturity or pay to exit early.
Operator strategy during a cut cycle focuses on protecting and growing net operating income through value add improvements, cost controls, and proactive leasing. Cap rate compression only helps if NOI holds or rises. Renovations that push rents, utility conversions that lower expenses, and aggressive vacancy management all protect the numerator in the valuation formula. Markets where investors can grow NOI faster than cap rate compression erodes yields offer the best risk adjusted returns, even if entry pricing feels elevated. How connected are interest rates and multifamily cap rates?
Six key investor actions during a Fed rate cut cycle:
- Market selection: Prioritize metros with strong job growth, limited new supply, and positive migration trends. Local fundamentals matter more than national policy.
- Underwriting discipline: Model multiple cap rate scenarios, including 50, 100, and 200 basis point shifts, and stress test NOI against vacancy and expense increases.
- Financing strategy: Lock fixed rate debt when cuts begin if you expect volatility or eventual rate reversals. Use floating rate debt if you expect sustained easing and plan to refinance or sell quickly.
- Cap rate scenario planning: Build acquisition and exit models with conservative cap rate assumptions. Avoid anchoring to historical lows from prior cycles.
- Risk assessment: Evaluate supply pipelines, rent growth trends, and operating cost inflation in target markets to identify where Fed cuts will compress cap rates versus where fundamentals will override policy benefits.
- Timing decisions: Refinance when spreads justify prepayment costs, sell when cap rate compression peaks and before supply or economic risks rise, and buy when distressed sellers or motivated institutions create pricing opportunities below replacement cost.
Final Words
When the Fed cut rates in Sept and Nov 2024, cheaper debt pushed required yields lower and set the stage for cap‑rate compression.
That math matters: a $500,000 NOI at 5.0% is $10M; at 4.0% it’s $12.5M — a big swing from a small rate move.
Timing and local factors (supply, NOI, Treasury spreads) change the speed and size of the move, so model 50–200 bps scenarios and watch refinancing windows.
Understanding how Fed rate cuts affect multifamily cap rates helps you spot opportunities and plan with confidence.
FAQ
Q: What is the 1% rule in multifamily?
A: The 1% rule in multifamily is a screening heuristic that says monthly gross rent should equal about 1% of purchase price; it’s rare in many markets—use only for quick filters, then model NOI and cap rate.
Q: What is a good cap rate for multifamily?
A: A good cap rate for multifamily depends on market and risk: core assets often trade 3.5–5.5%, while secondary or higher‑risk markets may need 6–8%. Compare to financing costs and your target return.
Q: How do interest rates affect real estate cap rates?
A: Interest rates affect real estate cap rates by setting financing and benchmark yields: rising rates usually push cap rates higher (lowering values), while falling rates often compress cap rates—subject to risk premiums and local fundamentals.
Q: What is the outlook for multifamily in 2026?
A: The outlook for multifamily in 2026 is cautiously positive: expected Fed easing should pressure cap rates lower and values higher, but outcomes will be patchy—watch rent growth, local supply, and Treasury spreads before acting.