

What if rising inventory is the best buying signal most investors miss?
It sounds odd, because more stock usually looks like weakening demand.
But inventory can also mean restocking, supply normalization, or a short overshoot that sets up fast recoveries.
This post walks investors through simple, practical checks, including inventory-to-sales, turnover (how fast stock moves), order backlogs, and price trends, to separate danger from chance.
Thesis: with the right filters you can time buys for better upside and less downside.
How Rising Inventory Signals Opportunity and Risk for Investors
Rising inventory cuts both ways. It can point to weakening demand, overbuilding, or a disconnect between what’s getting made and what people actually want. But it can also show up when companies are stockpiling ahead of expected demand, when supply chains are finally normalizing after years of chaos, or when there’s a temporary overshoot that sets the stage for a fast recovery once things shift. The difference between danger and opportunity depends on why inventory’s rising, where it’s piling up, and whether the reasons are cyclical or something deeper.
The inventory-to-sales ratio cuts through most of the noise. When inventory grows faster than sales, turnover slows down, cash gets tied up, and margins usually take a hit. But if sales are holding steady or even climbing while inventory ticks up, companies are often getting ready to grow, not pulling back. You separate these situations by tracking turnover speed, price movements, and order trends instead of obsessing over raw inventory numbers.
You see the clearest patterns in cyclical sectors: retail, commodities, manufacturing, tech hardware. A spike in retail inventory alongside dropping foot traffic and heavier promotions? Usually bearish. But a spike in semiconductor inventory during a known downcycle, while new orders are starting to stabilize? Historically, that’s marked turning points where patient buyers found their best entries. The trick is telling normal ups and downs from early warnings of real trouble.
Core bullish and bearish signals:
Bullish: Inventory rises but new orders stay stable or pick up. Rising inventory follows a supply chain mess and is just getting back to normal historical levels. Margins hold even with more stock sitting around. Inventory growth is concentrated in products that move fast.
Bearish: Inventory climbs while sales drop or stall out. Inventory-to-sales ratio expands more than 20% past the 5-year average. Days on hand stretch 15% or more without seasonal reasons. Margins compress alongside inventory growth, showing pricing pressure or markdown trouble coming.
Understanding Inventory-to-Sales Ratios
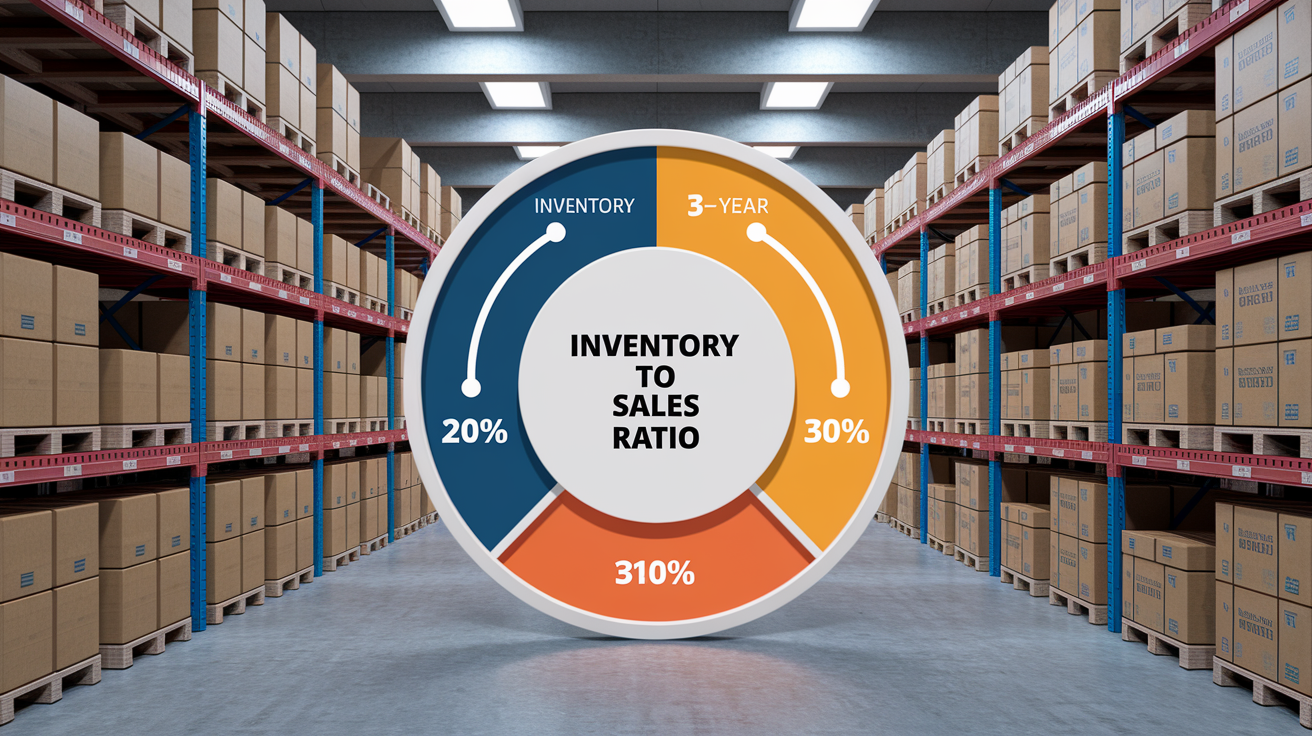
The inventory-to-sales ratio divides total inventory by total sales over a period, usually shown in months. A ratio of 1.5 means a company’s holding 1.5 months of inventory relative to how fast it’s selling right now. The ratio tells you whether inventory’s building because demand is slowing (bad) or because companies are buffering against supply shocks or ramping for growth (neutral to good). Rising ratios typically mean softening demand or overproduction. Stable ratios suggest healthy turnover even if total inventory levels are climbing.
Compare current ratios against the last 3 to 5 years and watch for big moves. A ratio that climbs 20% above its historical average is a yellow flag. One that spikes 30% or more, especially with falling orders or rising discounts? Red flag. A ratio staying within one standard deviation of the mean during a known restocking cycle is usually fine. Context matters as much as the number. Product mix, seasonality, all of it.
Three high-value uses of the inventory-to-sales ratio:
Demand health check: A rising ratio often comes before earnings misses and production cuts. Falling ratios can signal tightening supply and pricing power returning.
Timing turning points: Peak inventory-to-sales levels in cyclical sectors have historically marked the best buying opportunities 3 to 6 months before things visibly improve.
Sector rotation signal: Compare ratios across industries to spot where inventory pressure is easing first. Often the earliest movers in a recovery.
Sector Breakdown: How Rising Inventory Affects Different Industries

Retail Inventory Conditions
Retail inventory spikes are usually demand warnings. When retailers stockpile goods but foot traffic slows, promotions ramp up, and same-store sales flatten or fall, margin compression happens fast. The inventory-to-sales ratio in retail climbs when merchandise sits longer, and markdowns eat into gross profit. Not all retail inventory builds are bearish, though. Seasonal pre-stocking for holidays or back-to-school is routine. The difference shows up in sell-through speed and how aggressive the promotions get. If inventory rises in Q2 but sells cleanly in Q3, it’s normal cycle stuff. If inventory hangs around into Q4 and discounts widen, that’s structural weakness. Recovery opportunities show up when excess inventory clears, typically through heavy markdowns, and new order rates stabilize while the inventory-to-sales ratio drops back toward the historical average.
Manufacturing Inventory Trends
Manufacturing inventory tends to rise before production cuts hit. When factories overproduce relative to incoming orders, finished goods pile up, working capital locks up, and eventually management slows output to rebalance. Heavy inventory in manufacturing often comes before price cycles. Oversupply pushes prices down until production cuts tighten supply and prices recover. Commodity-linked manufacturers (steel, chemicals, building materials) show the clearest cycles. You can time entries by watching for inventory peaks paired with order stabilization or early signs of restocking by downstream customers. The lag between peak inventory and production cuts is usually one to two quarters, and the lag between cuts and price recovery another one to two. Patience during the inventory-build phase, when sentiment’s worst, often sets up the best risk-reward for cyclical manufacturing plays.
Technology Hardware Stockpiling
Technology hardware inventory (semiconductors, components, networking gear) reflects both demand cycles and supply chain buffering. After years of shortages, a lot of hardware companies over-ordered to make sure they had stock, leading to temporary gluts even as end demand stayed solid. Rising inventory in tech hardware isn’t always a demand problem. It can signal supply normalization or strategic safety stock. The tell is order backlog and lead times. If inventory rises but backlogs stay firm and lead times remain high, it’s buffering. If inventory climbs while backlogs shrink and lead times collapse, it’s weakening demand. Cyclical downturns in semiconductors have historically shown sharp inventory corrections followed by equally sharp recoveries once inventory clears and capital spending picks back up. Buying into the trough, when inventory-to-sales ratios peak and new order momentum starts to stabilize, has delivered strong returns in past cycles.
Consumer Discretionary Inventory Patterns
Consumer discretionary goods (apparel, home goods, toys, electronics) show high demand elasticity. Small changes in consumer confidence or disposable income drive big swings in sales. Rising inventory here often pairs with promotional activity. When discounts widen and inventory turns slow, it’s a sign that retailers and brands misjudged demand or consumer spending is softening. But discretionary inventory buildups can also reflect new product launches, channel expansion, or post-pandemic normalization. The key metric is price realization. If companies maintain pricing power despite higher inventory, demand is holding. If they resort to heavy markdowns, demand is cracking. Recovery trades emerge when inventory clears, promotional pressure eases, and pricing stabilizes. Usually signals the bottom is in and consumer spending is firming.
Distinguishing Normal Cycles from Warning Signs

Not every inventory increase is a red flag. Seasonal buildups are routine. Retailers stock up before holidays, manufacturers prepare for peak production windows, and these spikes reverse on schedule. Safety stock increases after supply chain disruptions are also normal. Companies that got burned by shortages often carry higher inventory as insurance, even when demand is stable. The challenge is separating these normal drivers from structural demand weakness or chronic overproduction.
The clearest way to tell the difference is tracking inventory alongside new orders, sales speed, and pricing trends. If inventory rises but new orders are stable or growing, it’s likely strategic stocking. If inventory climbs while orders fall and discounts widen, it’s a demand problem. Seasonal adjustments help too. Compare current inventory levels to the same month in prior years, not just to last month. A 15% inventory jump in October that matches the prior three Octobers is normal pre-holiday stocking. A 15% jump with no historical match is a warning.
Another useful filter is days on hand or inventory turnover. If turnover slows down a lot, inventory’s sitting longer, which usually means weaker demand or slower sales speed. If turnover holds steady even as total inventory rises, it often means higher sales volumes are absorbing the extra stock. Context always wins over headlines.
Bullish Indicators Hidden in Rising Inventory

Some of the best buying opportunities appear when inventory peaks and sentiment is worst. Cyclical sectors (commodities, industrials, semiconductors) often bottom when inventory-to-sales ratios hit multi-year highs and production cuts get announced. At that point, the market has usually priced in prolonged weakness, but the actual clearing process is faster than expected. Once inventory burns off and restocking begins, pricing power returns and earnings snapback quickly.
Another bullish signal is rising inventory concentrated in fast-moving or high-demand product lines. If a company’s stocking up on its best sellers while cutting slow movers, that’s prep for growth, not retreat. Similarly, inventory buildups that follow supply chain normalization (after years of shortages) often reflect companies making sure they don’t lose sales to stockouts. That’s confidence, not fear.
Four bullish conditions to watch for:
Inventory-to-sales ratio peaks and starts to decline while new orders stabilize or tick up. Signals the worst is over.
Production cuts are announced or underway, tightening future supply and setting up a pricing recovery.
Margins hold steady despite higher inventory, showing pricing power and healthy product mix.
Management guidance shifts from cautious to neutral or slightly optimistic. Often a sign internal data shows inventory clearing faster than expected.
Bearish Indicators: When Inventory Growth Signals Trouble

Persistent inventory growth paired with falling orders is the clearest red flag. It means companies are producing or ordering more than customers want, and the gap is widening. This pattern typically comes before earnings downgrades, margin compression, and eventually production cuts or layoffs. The longer the mismatch lasts, the deeper the correction usually runs.
Another warning sign is rising inventory concentrated in slow-turning or low-margin product lines. If a retailer’s sitting on last season’s goods or a manufacturer has a glut of commodity-grade products, pricing pressure intensifies and markdown risk climbs. When discounts widen and promotional activity spikes, it’s a signal that companies are prioritizing cash flow over margin, which usually means financial stress is building.
Four red flags that inventory growth is turning bearish:
Inventory-to-sales ratio rises for two straight quarters while sales decline or stall, showing chronic overproduction.
Days on hand lengthen by 15% or more without seasonal or strategic explanation, signaling slowing turnover and trapped capital.
Gross margins compress as promotional intensity or price cuts accelerate, showing companies are discounting to move excess stock.
New order rates fall below prior-year levels for three months running, confirming weakening demand and increasing the risk that inventory will keep piling up.
Inventory Impacts on Valuation and Earnings Forecasts

Rising inventory hits valuation in multiple ways. First, it ties up working capital. Cash that could be returned to shareholders or invested in growth sits in warehouses or on shelves. Higher inventory often means higher storage costs, insurance, and the risk of obsolescence or markdowns. Second, it pressures margins. When companies discount to clear excess stock, gross profit per unit falls, and if the discounting drags on, operating leverage reverses and earnings compress.
From a balance sheet perspective, inventory builds can inflate assets temporarily, but if that inventory later needs writedowns or markdowns, it creates a future earnings hit. Analysts often model inventory turns and days on hand into their forecasts. When those metrics worsen, forward earnings estimates usually get cut. Price-to-book ratios can also mislead during inventory buildups if the book value includes stock that won’t realize full value.
Cash flow investors watch inventory closely because rising inventory is a use of cash. On the cash flow statement, an increase in inventory reduces operating cash flow. If a company reports strong net income but operating cash flow is weak due to inventory growth, it’s a yellow flag that earnings quality is deteriorating. When inventory peaks and starts to decline, operating cash flow usually accelerates, which can support valuation expansion even before revenue growth picks back up.
Timing Strategies for Buying Stocks During Inventory Surges

Buying after inventory peaks, rather than during the buildup, historically improves entry points in cyclical sectors. The logic is simple. When inventory-to-sales ratios hit multi-year highs and production cuts are announced, the market has usually priced in prolonged weakness. But once inventory starts to clear, the path to recovery shortens, and sentiment can shift faster than fundamentals. The key is identifying when the peak is in, which usually shows up in sequential data (month-over-month or quarter-over-quarter inventory declines) paired with stabilizing or rising new orders.
Another timing tool is tracking promotional intensity and pricing trends. When discounts narrow and pricing stabilizes, it signals that excess inventory is clearing and demand is firming. This turning point often comes before earnings beats and upward estimate revisions by one to two quarters. Investors who wait for confirmation (rising sales and falling inventory) get more certainty but pay higher prices. Investors who buy at peak inventory, when data is still ugly, get better prices but take on more risk.
A disciplined approach balances both. Watch for inventory-to-sales ratios to stop rising, even if they haven’t declined yet. Look for management commentary shifting from concern to cautious optimism. And track order data closely. Stabilizing orders while inventory is still elevated is often the earliest signal that the bottom is forming.
Three-step timing framework:
Step 1: Identify when inventory-to-sales ratio stops accelerating and begins to flatten, even if total levels remain high.
Step 2: Confirm that new order rates are stabilizing or starting to tick up, showing demand is firming while excess inventory is clearing.
Step 3: Enter positions when management signals confidence (through guidance or commentary) and promotional pressure eases, reducing markdown risk and improving margin outlook.
Case Studies: How Inventory Trends Predicted Stock Performance

Retail 2015 Inventory Surge
In early 2015, major U.S. retailers reported inventory growth of 8% to 12% year-over-year while same-store sales growth slowed to low single digits or turned negative. The inventory-to-sales ratio spiked, and promotional activity picked up heading into spring and summer. Stocks sold off as analysts cut earnings estimates and flagged margin risk. By mid-2015, several retailers announced aggressive clearance events, and inventory levels began to decline sequentially. Those that acted fastest to clear inventory and stabilize pricing saw their stocks bottom in Q3 2015 and rally into early 2016 as comps improved and margins recovered. Investors who bought during the peak inventory scare, when sentiment was worst, captured the rebound. Those who waited for clean financials paid 15% to 25% higher prices by the time the turn was obvious.
Semiconductor 2019 Downcycle
The semiconductor industry entered 2019 with bloated inventory after a strong 2017 to 2018 cycle. Chipmakers and distributors reported inventory-to-sales ratios climbing 20% to 30% above historical averages. Orders slowed, and production cuts were announced across the industry. Stocks fell sharply in late 2018 and early 2019, pricing in a prolonged downturn. But by mid-2019, inventory data showed sequential declines, and order rates began to stabilize, particularly in automotive and industrial segments. Investors who bought during the inventory peak, when the narrative was bearish and estimates were still being cut, saw strong returns as the sector bottomed in Q2 2019 and rallied into 2020. The inventory clearing happened faster than expected, and once new orders firmed, the recovery was sharp.
Automotive 2022 Supply Recovery
Automotive inventory in 2022 told a different story. After years of semiconductor shortages and lean inventories, automakers began rebuilding stock in late 2021 and into 2022. Dealer lots, which had been nearly empty, started to fill. Headlines warned of oversupply, but the underlying data showed inventory rising from historic lows toward normal levels, not into excess. Days-supply metrics, which had been under 30 days for many models, climbed back toward 60 to 70 days, closer to pre-pandemic norms. Investors who interpreted the inventory rebuild as normalization rather than overproduction benefited as automakers maintained pricing power and margins remained strong. The inventory increase was strategic restocking, not demand weakness, and stocks in the sector performed well through the year as production constraints eased and sales stayed solid.
Metrics Checklist for Evaluating Rising Inventory
Tracking the right metrics turns inventory data into actionable signals. Start with the core list and add sector-specific indicators as needed.
Inventory turnover ratio: Frequency at which inventory is sold and replaced. Declining turnover signals slowing demand or excess stock.
Days on hand / Days inventory outstanding: Number of days inventory sits before selling. Rising days on hand shows slower sales speed and potential markdown risk.
Inventory-to-sales ratio: Inventory level relative to sales pace. Compare current ratio to 3 to 5 year average and watch for moves above 20%.
New order rates and backlog trends: Leading indicators of future demand. Stabilizing or rising orders while inventory is elevated suggests clearing is underway.
Gross margin and promotional intensity: Margin compression and increased discounting reveal pricing pressure from excess inventory. Stable margins despite rising inventory signal healthy product mix and demand.
Building a Practical Buy/Sell Framework Based on Inventory Trends
A structured framework keeps decisions consistent across cycles and removes emotion from the process. The goal is defining clear thresholds that trigger action, whether that’s starting a position, adding to it, trimming, or exiting entirely. Inventory trends rarely work alone. They’re most powerful when combined with order data, margin trends, and valuation metrics.
The framework should separate cyclical inventory patterns (normal, often opportunity-rich) from structural inventory problems (persistent, often value traps). In cyclical sectors, peak inventory paired with stabilizing orders is usually a buy signal. In non-cyclical or growth sectors, rising inventory without matching sales growth is usually a warning to avoid or trim. The key is defining what “peak” and “stabilizing” mean quantitatively, so decisions are repeatable and not subject to narrative bias.
| Signal | Recommended Action |
|---|---|
| Inventory-to-sales ratio peaks and starts to decline; new orders stable or rising | Start position or add; risk-reward favors entry as clearing begins |
| Inventory rising but margins stable; turnover unchanged; orders firm | Hold or small add; inventory likely strategic or seasonal, not demand weakness |
| Inventory climbing for 2+ quarters; orders falling; margins compressing | Trim or exit; persistent imbalance shows structural demand problem |
| Inventory-to-sales ratio >20% above 5-year mean; promotional activity intensifying | Avoid new positions; wait for inventory clearing and order stabilization before considering entry |
Final Words
In the action: rising inventory isn’t automatically bad. It can mean slowing demand, excess stock, or a setup for a rebound, and timing plus sector context change the story.
This article covered inventory-to-sales, sector differences, bullish and bearish signals, valuation effects, timing rules, and a compact checklist you can use when sizing positions.
Use this framework for interpreting rising inventory for investor buy strategies. With clearer signals and a patient entry plan, inventory swings can turn into opportunity.
FAQ
Q: What are the three major types of inventory strategies?
A: The three major inventory strategies are push (produce to forecast), pull (produce to demand, like JIT), and hybrid (a mix that balances responsiveness with efficiency).
Q: What happens when inventory increases?
A: When inventory increases, it often reflects slowing demand, overproduction, or deliberate stockpiling; it ties up cash, can squeeze margins, and might signal risk or a future buying opportunity if demand rebounds.
Q: What is the inventory analysis of investments?
A: The inventory analysis of investments is assessing inventory levels, turnover, aging, and inventory-to-sales to gauge demand trends, margin pressure, working-capital needs, and timing for buy or sell decisions.
Q: How do we determine optimal inventory level?
A: We determine optimal inventory level by balancing service targets, carrying costs, and stockout risk using EOQ, safety stock, reorder points, demand variability, and lead-time calculations.