

Want a quick reality check: home prices raced past rents in 2021 in most U.S. markets.
Nationally, home values jumped 18.9% year over year while asking rents rose 11.0%.
That gap widens the price-to-rent ratio and makes buying relatively pricier.
State-by-state, however, the story changes. Some Sunbelt states saw both surge, while coastal hubs had muted rents and big price gains.
This post maps where housing costs are rising faster and what that means for renters, buyers, and investors.
State-by-State Comparison of Rent Growth vs Home Price Growth

Home prices beat rent growth in almost every major U.S. market during the recent surge. Not by a little, either. In 2021, home values jumped 18.9% year over year nationally, up from just 5.7% the year before. Asking rents climbed 11.0% over the same period, accelerating from 1.2% in the prior year. Both numbers surged, but home prices ran faster. Across the 100 largest metros tracked, price appreciation outpaced rent growth by an average of 7.9 percentage points.
That gap isn’t just a data quirk. When home prices climb faster than rents, the price to rent ratio widens. Homeownership gets relatively more expensive compared to renting. Nationally, that ratio rose from 13.0 in 2020 to 14.0 in 2021. Back in 2015, it sat at 11.6. If you’re trying to decide whether to buy or lease, this spread determines how much more cash you need upfront and how long ownership takes to pay off versus staying a renter. For investors, it signals shrinking gross yields, capital gains outrunning income, and shifting cash flow math.
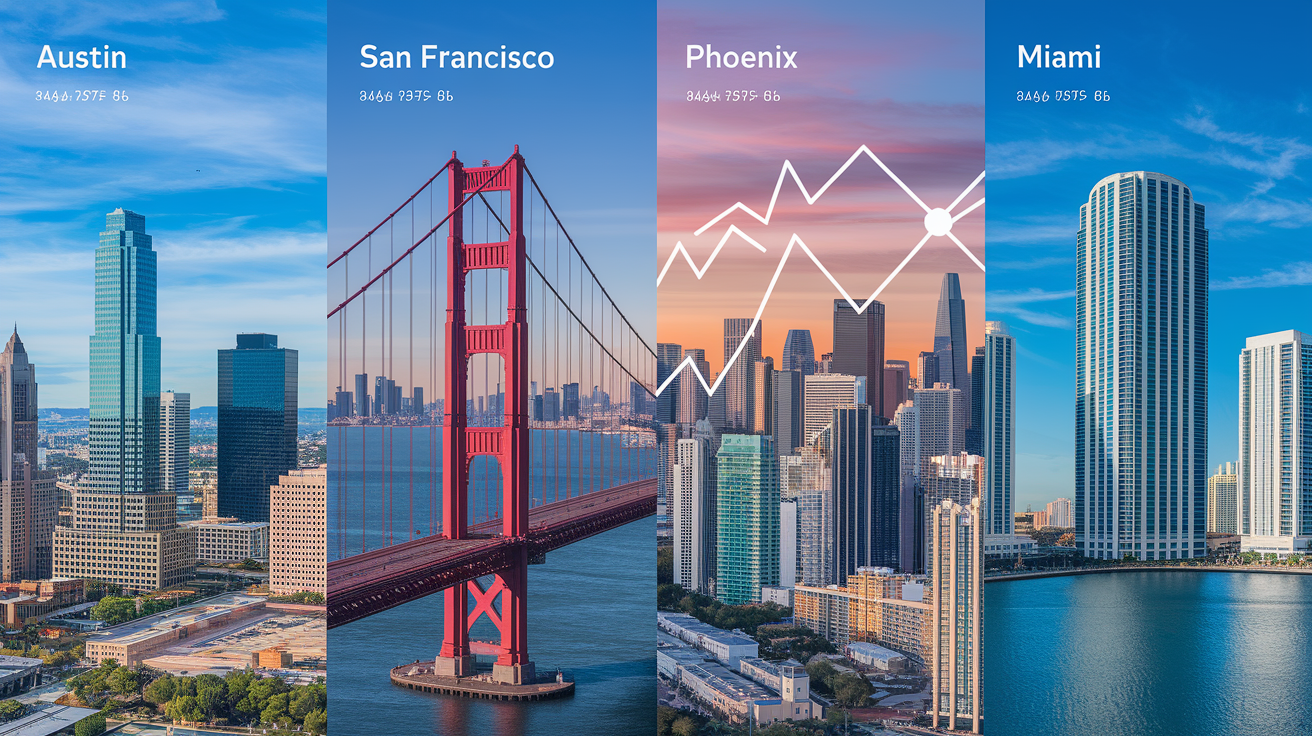
State data reveals enormous variation beneath the national averages. In 99 of the 100 large markets tracked in September 2021, home values increased by double digits. Rents rose in all 100 markets, with 64 seeing rent growth of at least 10%. But the size and speed of both moves varied dramatically by state and metro. Days on market dropped to 13 in Washington state, signaling fierce seller’s markets. South Carolina hovered at 62 days, offering buyers more breathing room. Median home prices ranged from around $562,750 in Austin, Texas, to roughly $1.4 million in San Francisco, California. Each state’s combination of rent growth, home price appreciation, inventory levels, and migration patterns creates a distinct affordability and investment profile that buyers, sellers, landlords, and analysts need to track.
| State | 1-Year Rent Growth | 1-Year Home Price Growth | Rent-to-Price Ratio |
|---|---|---|---|
| Florida (Tampa metro) | +23.0% | +29.1% | 0.071 |
| Arizona (Phoenix metro) | +23.0% | +32.5% | 0.068 |
| Nevada (Las Vegas metro) | +22.5% | +24.2% | 0.074 |
| California (San Francisco metro) | +3.2% | +17.7% | 0.052 |
| California (San Jose metro) | +2.6% | +15.8% | 0.048 |
The table shows the pattern clearly. In hot Sunbelt metros, rent and home price growth both surged into the 20%+ range, yet price appreciation typically exceeded rent growth. In high cost coastal California markets, rent growth stayed subdued (often single digits) while home prices still climbed by double digits, widening the price to rent gap even further. The rent to price ratio (annual median rent divided by median home price) dropped in markets where home values accelerated fastest, signaling lower gross yields for buy and hold investors and higher upfront costs for would be buyers.
Understanding Growth Metrics in Rent and Home Prices Across States

Rent growth and home price appreciation are measured using different indices, which is why they don’t always move in lockstep. Rents get tracked via asking rent indices that focus on the 40th to 60th percentile of available rental units, weighted to reflect the existing rental stock. Home values use typical price indices covering the 35th to 65th percentile of sold homes, again weighted by the composition of each market’s housing stock. Both series measure changes over time rather than absolute levels. So a market showing 11% rent growth and 18% home price growth is seeing both costs rise, but home prices are climbing nearly twice as fast as rents.
The difference between these growth rates reveals critical market dynamics. Mortgage rates, local construction activity, migration patterns, inventory levels, and shifting household demand all influence the speed at which rents and home prices move. Rent growth surged from just 1.2% year over year nationally to 11% in 2021. Nearly tenfold acceleration. Home price growth jumped from 5.7% to 18.9% over the same window. The price to rent ratio climbed from 11.6 in 2015 to 14.0 in 2021, indicating homes became substantially more expensive relative to rents over that six year span. Mortgage rates, which dipped to their lowest levels since February 2024 in August 2024, also play a major role. Lower rates can fuel price growth by making monthly payments more affordable at higher purchase prices, but they don’t directly push rents higher.
Understanding what drives each metric helps you anticipate future moves.
Mortgage rates boost buying power and home price growth when they drop. Higher rates cool price appreciation and can push marginal buyers into renting, supporting rent demand.
New construction and housing starts matter. More multifamily completions increase rental supply and moderate rent growth. More single family starts add inventory that can slow home price appreciation.
Population and household migration directly drive both rent and home price demand. Inbound migration to a state fuels both. Outmigration from expensive metros can suppress rent growth in origin cities.
For sale inventory levels set the tone for buyer competition. Tight inventory (below the healthy 5 to 6 months benchmark) accelerates price competition among buyers. Higher inventory slows price gains and can extend days on market.
Household income and credit access support rent and price growth when rising. Tighter lending standards (like the post 2008 pullback) constrain buyer demand, pushing more households into rentals and boosting rent pressure.
Regional Differences in Rent and Home Price Growth Trends

Rent growth and home price surges concentrated heavily in the South and West during the recent boom, while many coastal and Midwest markets saw slower rent increases even as home prices still climbed. Migration patterns drove much of this divergence. High cost hubs (Los Angeles, San Francisco, New York) experienced net domestic outflows as households moved to more affordable metros in the Midwest, Southwest, and South Atlantic states. That demand shift supercharged both rents and home prices in destination markets. Phoenix saw home prices jump roughly 32.5% year over year in September 2021, paired with 23% rent growth. Las Vegas posted 22.5% rent growth and 24.2% home price appreciation. Sarasota, Florida, led rental growth at 24.6%, while Tampa notched 23% rent increases.
At the other end, some high cost coastal metros saw much slower rent growth. San Jose recorded just 2.6% year over year rent growth in September 2021, San Francisco 3.2%, and Minneapolis 4.4%. Yet even these “slow” markets still matched or exceeded their pre pandemic rent growth pace, and home prices in each climbed by double digits (San Jose +15.8%, San Francisco +17.7%, Minneapolis roughly mid teens). The combination of modest rent growth and strong price appreciation widened the price to rent ratio in those markets, making buying even less attractive relative to renting. Vacancy rates in some coastal metros increased by about 2 to 3 percentage points during 2020 and remained elevated into late 2021, evidence of pandemic era demand shifts that temporarily eased rental competition while home sales surged.
Regional growth drivers vary significantly.
South benefited from strong population inflows, lower property taxes, relatively permissive zoning in some metros, and affordability compared to coastal markets. Both rent and price surges followed. Construction activity picked up but struggled to keep pace with demand.
West saw migration into Sunbelt metros (Phoenix, Las Vegas, Boise) combined with limited new supply, producing explosive rent and price growth. California metros saw outflows that moderated rent pressure, but home prices still rose on scarce inventory and high land costs.
Midwest gained migration inflows from expensive coasts that supported demand. Slower historical growth and lower starting prices meant percentage gains appeared smaller, but some metros (Canton, Ohio) experienced sharp price jumps tied to abysmal single family construction.
Northeast delivered mixed outcomes. High cost metros (New York, Boston) saw vacancy increases and slower rent growth. Smaller metros benefited from remote work relocations, driving price appreciation even as rents lagged.
Rent to Price Ratios and Affordability by State

The rent to price ratio (annual median rent divided by median home price) offers a simple way to compare the relative cost of renting versus buying in a given state. A higher ratio means rents are expensive relative to home prices, which usually signals stronger cash flow for landlords and a shorter payback period for investors. A lower ratio means home prices have climbed much faster than rents, reducing gross yields and making ownership costlier upfront. Nationally, the price to rent ratio (the inverse measure, home price divided by annual rent) rose from 13.0 in 2020 to 14.0 in 2021. Homes became more expensive relative to rents in just one year.
Affordability shifts hit lower income households hardest. Rent inflation tracked nominal income growth for roughly 25 years. Unusual and unsustainable. Real incomes across most brackets rose about 10% from 2015 to 2022 when adjusted for general inflation, but after adjusting for regressive rent inflation, real incomes at the bottom were flat. No growth for seven years, as one tracker put it. The poorest households still pay roughly 25 percentage points more of their income toward housing than the richest earners, a burden that widened as rents surged faster than wages at the low end. For middle and higher income renters, the calculus shifted too. Exceptional home price appreciation and scarce for sale inventory blocked many would be buyers, swelling the pool of middle income renters and sustaining upward pressure on rents across the rent distribution.
| State | Rent-to-Price Ratio | Median Household Income | Rent Burden Level |
|---|---|---|---|
| Texas (Austin metro) | 0.069 | $73,800 | Moderate–High |
| California (San Francisco metro) | 0.052 | $112,400 | Very High |
| Florida (Tampa metro) | 0.071 | $59,200 | High |
| Nevada (Las Vegas metro) | 0.074 | $63,900 | Moderate |
Renters and buyers can use these ratios to gauge whether it makes more financial sense to rent or buy in a particular state. A low rent to price ratio (high price to rent ratio) suggests buying requires a much larger upfront investment and longer holding period to break even versus renting. A higher rent to price ratio signals that rents are high relative to purchase prices, which can favor buying if you can afford the down payment and qualify for a mortgage. For investors, a higher ratio means better gross yield. For renters, it means you’re paying a larger share of the home’s value each year in rent, which can make ownership more attractive if financing costs are manageable.
Housing Supply, Inventory Levels, and Their Impact on Growth Rates

Supply constraints are the single biggest driver of both rent and home price growth divergence across states. A healthy housing market typically carries about 5 to 6 months of for sale inventory. Enough to give buyers options without flooding the market. When inventory falls below that benchmark, competition intensifies, days on market shrink, and prices accelerate. When supply exceeds 6 months, buyer negotiating power increases, days on market extend, and price growth moderates or reverses. The post 2008 mortgage access contraction acted as a nationwide supply shock, pulling back the pool of qualified buyers and inadvertently pushing more households into the rental market. Academic research estimates that annual rent growth would have been about 2.1 percentage points lower from 2010 to 2014 in metro areas where lending standards tightened most, had the credit pullback not occurred.
Construction levels vary wildly by state and metro. Utah, for example, saw new home construction resume in 2024 after a slowdown, helping to ease some price pressure. Canton, Ohio, experienced extreme home price increases linked to abysmal single family construction and insufficient multifamily building. Even when demand moderates, inadequate supply keeps upward pressure on both rents and home prices. Multifamily construction directly affects rental supply. Single family starts influence for sale inventory, but also indirectly affect rents. Homeowners who can’t sell often choose to rent out their property rather than let it sit vacant, adding rental units but not for sale inventory.
Common supply constraints that limit construction and drive up growth rates:
Zoning restrictions prevent builders from adding units where demand is strongest. Single family only zoning, minimum lot sizes, and density caps limit new supply, particularly in job rich coastal metros.
Regulatory delays add months or years to project timelines. Lengthy permit approval processes, environmental reviews, and discretionary hearings increase costs and discourage new starts.
Construction feasibility and financing issues can make projects “not pencil” financially. Rising material costs, labor shortages, and higher interest rates matter, though regulatory and credit constraints remain larger obstacles than construction economics alone.
Land shortages and geographic constraints create physical limits on expansion. Coastal cities hemmed in by water, mountains, or protected lands face real boundaries. Arizona’s water scarcity issues, for instance, have slowed approvals in some counties.
Mortgage access and investor restrictions reduce the pool of qualified buyers. Tighter lending standards constrain effective demand. Recent policy moves targeting investor purchases in some markets further limit buyer competition, which can paradoxically boost rental demand and rents.
Rankings: Fastest and Slowest Growing States for Rents and Home Prices

Ranking states by rent growth and home price appreciation reveals which markets are heating up and which are cooling. In September 2021, the fastest rental growth metros were concentrated in Florida, Arizona, and Nevada. Sarasota topped the rent growth leaderboard at 24.6% year over year, followed by Tampa and Phoenix (both 23.0%), and Las Vegas at 22.5%. Each of these metros also saw explosive home price growth. Phoenix led home price appreciation at 32.5%, Tampa climbed 29.1%, and Las Vegas rose 24.2%. The only major market where rent growth outpaced home price growth was Miami, which posted 19.7% rent growth versus 18.2% home value appreciation. A rare exception driven by exceptionally strong rental demand from relocating households and international buyers parking capital in condos rather than renting them out.
Top five fastest rent growth states (metro examples, September 2021):
Florida (Sarasota metro) posted 24.6% rent growth, driven by pandemic era migration, retiree inflows, and limited multifamily supply relative to demand.
Florida (Tampa metro) hit 23.0% rent growth, mirroring Sarasota’s dynamics with additional corporate relocations and tourism recovery boosting demand.
Arizona (Phoenix metro) recorded 23.0% rent growth, fueled by California outmigration, corporate expansions, and constrained multifamily completions.
Nevada (Las Vegas metro) saw 22.5% rent growth, recovering tourism employment and housing cost refugees from California driving renter demand.
Florida (Miami metro) reached 19.7% rent growth, with international demand and domestic relocations creating fierce rental competition despite new condo supply.
At the opposite end, the slowest rent growth metros in September 2021 were predominantly high cost coastal cities. San Jose recorded just 2.6% year over year rent growth, San Francisco 3.2%, Minneapolis 4.4%, Des Moines 4.8%, and Madison, Wisconsin, 4.9%. Yet even these “slow” markets still matched or exceeded their pre pandemic rent growth rates, and home prices in each climbed by double digits. Des Moines +12.4%, San Francisco +17.7%, San Jose +15.8%. The divergence between modest rent growth and strong price appreciation in these metros widened the price to rent ratio sharply, making buying far more expensive relative to renting and signaling weak cash flow prospects for new landlord investors.
Case Studies: States and Cities with Extreme Rent vs Price Divergence
Austin, Texas saw its median home price hit approximately $562,750 during the recent surge, propelled by tech sector growth, California transplants, and rapid population growth. Rent growth in Austin tracked close to the state’s hottest metros, climbing into the high teens to low twenties year over year at the peak. Home prices, however, accelerated even faster, driven by fierce buyer competition, limited for sale inventory, and cash offers from out of state buyers. The result was a widening price to rent gap, where buying required significantly more capital upfront than renting, even as rents themselves climbed sharply. For investors, Austin offered strong capital appreciation but shrinking gross yields as prices outpaced rental income growth.
San Francisco, California saw one of the smallest rent growth rates among large metros, just 3.2% year over year in September 2021. Yet home prices still rose 17.7% in the same period. The divergence stemmed from pandemic era vacancy increases (up 2 to 3 percentage points), remote work departures, and a temporary easing of rental demand in the urban core. Home prices, by contrast, remained resilient due to constrained for sale inventory, strict zoning, and continued demand from high income tech workers who could afford to buy despite price increases. The price to rent ratio in San Francisco widened to one of the highest in the nation, making renting far cheaper than buying on a monthly cash flow basis. For additional context on how state level trends shape local dynamics, see U.S. State Housing Market Trends.
Phoenix, Arizona exemplified the opposite pattern. Rents and home prices both surged in tandem. Rent growth hit 23% year over year, while home price appreciation reached 32.5%, one of the fastest in the country. Migration from California, corporate relocations, and limited multifamily supply fueled rental demand. On the ownership side, low inventory, fast population growth, and buyer competition from investors and primary residence purchasers drove prices up faster than rents. Even though both metrics climbed sharply, the larger price gain widened the price to rent ratio, signaling that buying required a bigger upfront bet relative to rental income.
Miami, Florida stands out as the only major metro where rent growth outpaced home price growth during the 2021 surge. Rents climbed 19.7% year over year, while home values rose 18.2%. The inversion reflected exceptionally strong rental demand from domestic relocations, international arrivals, and limited rental supply in desirable neighborhoods. Home price growth, though still robust, was tempered slightly by new condo construction and a higher share of investor owned units that remained vacant or were converted to short term rentals rather than long term leases. For renters, Miami became one of the least affordable markets. For investors, the higher rent growth rate offered better cash flow prospects relative to purchase price than most other hot metros.
Key divergence patterns by case:
Austin showed price growth far exceeding rent growth, widening the affordability gap with strong capital appreciation but shrinking yields.
San Francisco delivered minimal rent growth but strong price growth, driven by tight for sale supply and high incomes despite rental market softness.
Phoenix saw both rents and prices surge, but prices grew faster, reflecting intense buyer and renter competition in a supply constrained market.
Miami experienced rent growth slightly outpacing price growth, unique among major metros, driven by exceptional rental demand and condo supply dynamics.
Investment Implications of Rent Growth vs Home Price Growth

When home price growth outpaces rent growth by an average of 7.9 percentage points across markets (as it did in 2021), investors face a choice: chase capital appreciation or prioritize cash flow. Markets where prices surge faster than rents offer stronger potential for equity gains, flipping, and value appreciation, but deliver shrinking gross yields and weaker near term cash flow. Markets where rent growth keeps pace with or exceeds price growth (rare, but Miami in 2021 is an example) offer better income relative to purchase price, which suits buy and hold landlords focused on monthly returns rather than resale profits.
The rising price to rent ratio across most states signals that gross yields (annual rent divided by purchase price) have fallen. If you buy a $400,000 property that rents for $2,000 per month ($24,000 annually), your gross yield is 6%. If the home price jumps to $500,000 while rent only rises to $2,200 per month ($26,400 annually), your gross yield drops to 5.28%. Lower yields mean longer payback periods, higher sensitivity to vacancy, and less margin for maintenance costs or property tax increases. Investors who bought in 2019 or 2020 and held through 2021 and 2022 captured exceptional capital gains, but new investors entering at 2021 peak prices face tighter cash flow math and greater exposure to price corrections if demand softens.
Three takeaways for investors comparing rent and price growth:
Capital gain plays favor markets where price growth significantly exceeds rent growth. Focus on metros with strong population inflows, constrained supply, and high buyer competition. Accept lower gross yields in exchange for faster equity buildup and exit appreciation.
Cash flow plays favor markets where rent growth matches or exceeds price growth. Rare, but look for metros with strong renter demand, limited new rental supply, and home prices that haven’t yet surged beyond local income levels. Prioritize stable occupancy and rent escalation over price appreciation.
Vacancy and occupancy trends directly affect realized yield. Even strong rent growth markets can produce weak cash flow if vacancy increases (as happened in some coastal metros during the pandemic). Monitor local rental vacancy rates and adjust rent expectations to market conditions rather than assuming asking rents translate to collected rents.
Forecasting Future Rent and Price Growth Patterns

Predicting future rent and home price growth requires watching a handful of leading indicators. Mortgage rates, which dipped to their lowest levels since February 2024 in August 2024, influence buyer demand and home price momentum. Lower rates can reignite price appreciation even in markets where inventory has risen. New home construction resumed in 2024 in some states (Utah, for example), which should gradually ease supply constraints and moderate price growth. Though the lag between permits, starts, and completions means relief often takes 12 to 18 months to materialize. Rent growth moderated somewhat after 2022 as incomes rose and pandemic era distortions faded, but rents remain elevated relative to historical norms and have not given back the sharp 2021 to 2022 gains.
State level crash risk checklists help identify markets most vulnerable to sharp corrections. Watch for sharp price increases that far outpace local income growth. Classic warning sign of unsustainability. Speculative buying (high concentrations of investor purchases, flipping activity, and cash offers) can inflate prices beyond fundamentals. Lowered lending standards (increased use of adjustable rate mortgages, no doc loans, or loosened debt to income ratios) raise the risk of buyer defaults if rates rise or the economy weakens. Increased construction paired with falling demand creates oversupply risk. Inventory surges while buyer competition cools, leading to price cuts and longer days on market.
Five forecast signals to monitor in every state:
Mortgage rate trends matter every week. Track weekly rate movements. A sustained rise of 0.5 points or more can quickly cool buyer demand and slow price growth, while rate drops can reignite competition and push prices higher.
New construction pipeline signals future supply. Follow building permits, housing starts, and completions by single family and multifamily. A spike in permits today signals supply relief 12 to 18 months out, moderating both rent and price growth.
Inventory levels and days on market set the competitive tone. Rising inventory (above 5 to 6 months) and lengthening DOM (60+ days) signal buyer hesitancy and price growth deceleration. Falling inventory and sub 30 day DOM suggest continued upward pressure.
Net migration and population flows drive long term demand. Track domestic inbound and outbound migration by state. Sustained inflows support both rents and prices, while outflows ease demand and can trigger rent concessions and price cuts.
Rent to income and affordability ratios reveal breaking points. Monitor median rents as a percentage of median household income. When rents consume more than 30% of median income, demand destruction and political pressure for rent control increase, capping future rent growth and dampening investor returns.
Final Words
In the action, we mapped state-by-state rent and home-price moves, highlighted national benchmarks (2021: rents ~+11%, home prices ~+18.9%), and showed how regions and supply drove those gaps.
We explained measurement choices, rent-to-price ratios, affordability effects, and investor takeaways, plus short case studies and sample tables to make the signals concrete.
Use the state snapshots to set priorities—buyers watch rates and inventory, renters weigh rent burden. The rent growth vs home price growth by state view cuts through the noise and points to clear opportunities for prepared participants.
FAQ
Q: What is the 3-3-3 rule in real estate?
A: The 3-3-3 rule in real estate isn’t universal; it often refers to short-hand investor guidelines—common uses include 3 months’ reserves, a 3-year hold target, or a 3% contingency estimate.
Q: What is the 7% rule in real estate?
A: The 7% rule in real estate is a heuristic where investors target roughly a 7% annual return or cap rate on a rental property as a quick baseline for acceptable investment.
Q: What is the 2% rule in rental property?
A: The 2% rule in rental property says monthly rent should be at least 2% of the purchase price to screen for likely positive cash flow; use full underwriting to confirm.
Q: What is the 50% rule in rental property?
A: The 50% rule in rental property says about half of gross rental income typically goes to operating expenses (excluding mortgage), giving a fast estimate of net operating income.