

Is the housing market finally giving buyers room to breathe?
This week the national median existing‑home price held near $402,100 (down 0.1% week over week, up 0.9% year over year).
Active listings nudged up to 1.31 million, a 1.5% weekly rise that pushed months of supply to 3.9.
But mortgage rates ticked to 6.62%, which cooled purchase applications.
Bottom line: small moves are creating local windows for negotiation.
Read on for what drove the shift, what it means for buyers and sellers, and practical next steps to consider.
Latest Weekly U.S. Housing Market Snapshot

National median home prices stayed mostly flat through the first week of March 2026. Inventory nudged up while buyer activity showed signs of hesitation. The median existing-home price came in at $402,100, down 0.1% from the prior week and up 0.9% year over year. That’s part of a pattern we’ve been seeing since late 2025—flat to modest annual gains, nothing dramatic.
Active listings increased to 1.31 million units, a 1.5% weekly bump that pushed months of supply to 3.9 months. Still below the six-month mark you’d normally call balanced. New listings dropped 3.2% week over week, which isn’t unusual for early March. Sellers often wait until spring marketing windows open up before putting homes on the market.
Mortgage rates ticked up slightly. The average 30-year fixed rate landed at 6.62% as of March 6, 2026. That’s up seven basis points from the prior week, ending a six-week stretch of declining rates. The small uptick cooled mortgage application volume immediately—down 4.1% week over week. Median days on market held at 38 days, unchanged from the previous week. Homes are moving at a steady pace, but there’s no urgency.
The combination of stable pricing and rising inventory suggests buyers have more selection. Sellers still have pricing power in many metros.
Purchase mortgage applications remained 11% below year-ago levels despite recent rate improvements. Affordability headwinds and cautious buyer sentiment are real. The slight weekly decline in applications suggests many buyers are pausing to see if rates stabilize or drop further before they commit to offers.
- National median home price: $402,100 (down 0.1% week over week, up 0.9% year over year)
- Active inventory: 1.31 million units (up 1.5% weekly, representing 3.9 months of supply)
- New listings: Down 3.2% from prior week (seasonal pattern holding)
- 30-year mortgage rate: 6.62% (up seven basis points weekly, purchase applications down 4.1%)
Regional Price Movements and Inventory Shifts
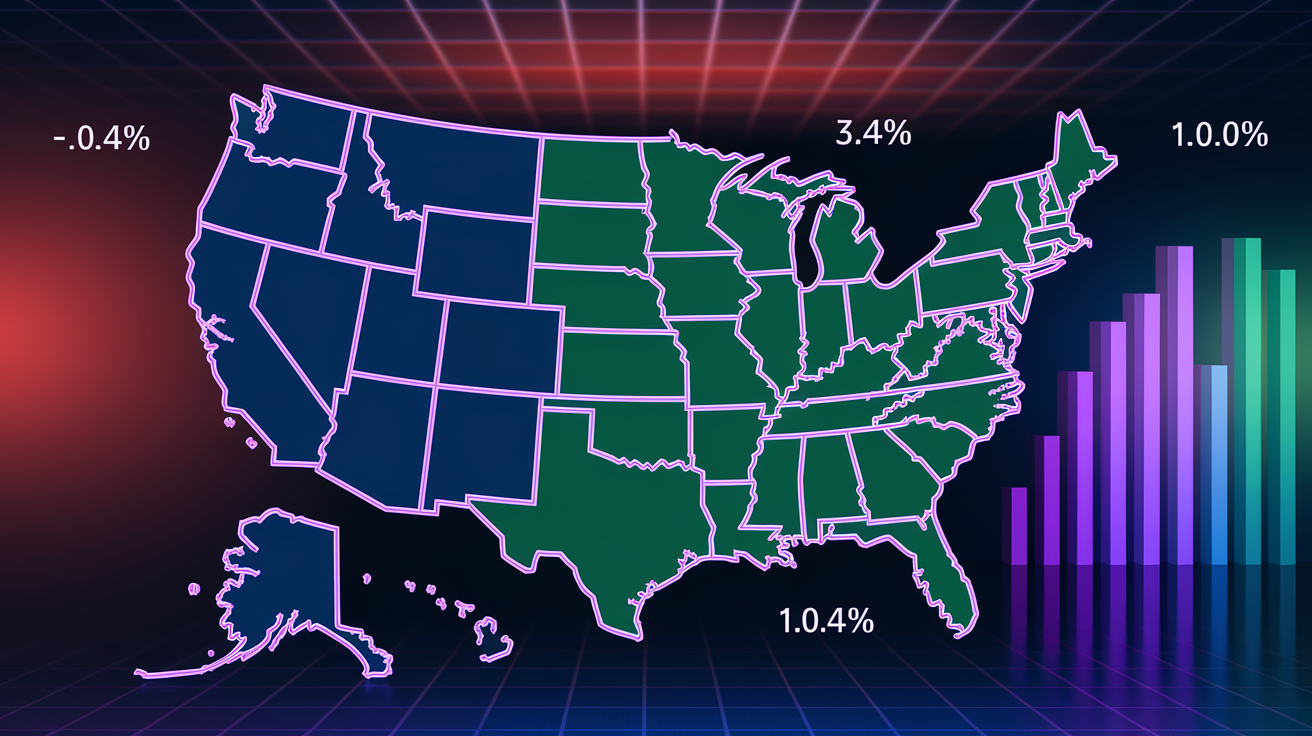
The West continued to show the softest price momentum. Median prices dipped 0.4% week over week and posted only a 0.3% gain year over year. High for-sale inventory in California metros pushed months of supply above five months in several submarkets. Sacramento, Riverside, and parts of the Bay Area are giving buyers meaningful negotiating leverage.
The Midwest posted the strongest weekly performance. Prices up 0.2% from the prior week and 1.8% year over year, supported by tighter inventory at 3.2 months of supply. Steady demand from first-time buyers drawn to affordability relative to coastal markets is holding things up.
The South held relatively flat. Median prices unchanged week over week and up 1.1% year over year. Inventory climbed to 4.1 months of supply as builders in Texas, Florida, and North Carolina continued adding new-home supply. The Northeast saw a modest weekly decline of 0.2%, but year-over-year gains of 1.0%. Constrained by persistently low inventory at 3.4 months and limited new construction.
Across all regions, the pattern is consistent. Where inventory sits below four months, prices hold or edge higher. Where it climbs above four months, sellers face pricing pressure and longer marketing times.
| Region | Weekly Price Change | Year-over-Year Change | Active Inventory Level (Months) |
|---|---|---|---|
| West | -0.4% | +0.3% | 5.0 |
| Midwest | +0.2% | +1.8% | 3.2 |
| South | 0.0% | +1.1% | 4.1 |
| Northeast | -0.2% | +1.0% | 3.4 |
Key Market Drivers Influencing Prices This Week

Mortgage rates broke a six-week improvement streak, ticking up to 6.62% from 6.55% the prior week. Stronger than expected job growth data released March 3 reignited concerns about persistent inflation and delayed Federal Reserve rate cuts. That seven basis point move sounds small, but on a $400,000 loan it adds roughly $17 per month to principal and interest. Enough to nudge some buyers back to the sidelines.
Purchase application volume dropped 4.1% week over week, the sharpest single-week decline since early February. Refinance applications fell 6.8%. Even modest rate increases immediately dampen activity.
Demand side signals remain mixed. Showing traffic held roughly flat week over week, suggesting buyers are still touring homes but converting fewer tours into offers. Pending sales data showed a slight uptick in late February, but that momentum stalled in early March as rates climbed. Buyers with pre-approved financing and flexibility are still moving. Marginal buyers at the edge of affordability are pausing to reassess budgets or waiting for seasonal rate dips that may or may not materialize.
Supply conditions continue to loosen gradually. Active inventory rose 1.5% week over week, driven by new listings from homeowners who locked in low rates in 2020 to 2021 and are now forced to move for job or family reasons. Plus homes re-listed after failed sales in prior months. New listings dropped 3.2%, a typical early March pullback. But sellers who do list are pricing more conservatively. Median list prices fell 0.3% from the prior week, the first weekly decline since mid-January.
Days on market held steady at 38. Homes priced at or slightly below market are still clearing quickly. Overpriced inventory is accumulating.
Short-Term Market Outlook (Next 4 to 8 Weeks)

The next four to eight weeks will likely see continued price stability with pockets of regional variation. Inventory builds seasonally and mortgage rates fluctuate in a narrow band around 6.5% to 6.7%. Economists surveyed by major housing data firms expect national median prices to stay within plus or minus 1% of current levels through April. Stronger gains in supply constrained Midwest and Northeast metros. Modest declines in high inventory Western markets.
The Federal Reserve’s March 18 to 19 FOMC meeting will be a key inflection point. If inflation data published mid-March surprises to the downside, markets may price in a slightly higher probability of a June rate cut. That could pull mortgage rates back below 6.5% and reignite buyer activity. If inflation remains sticky, rates could drift toward 6.75%, further dampening purchase applications and extending the current low volume environment.
Inventory is expected to climb steadily through mid-April as spring listing season accelerates. Forecasters project months of supply to reach 4.3 to 4.5 months nationally by late April, the highest level since mid-2020. That additional supply will give buyers more negotiating leverage, particularly in markets where new-home construction is adding hundreds of units per month.
Sellers who price aggressively and prepare homes well will still clear in 30 to 40 days. Homes priced more than 3% above comparable recent sales will likely sit for 60-plus days and require price cuts. Investors watching cap rates and rent to price ratios should expect stable to slightly declining purchase prices offset by continued rent growth in tight rental markets. Cash-flow scenarios remain roughly neutral.
Actionable Steps for Buyers, Sellers, and Investors

Buyers:
Lock mortgage rates when they dip below 6.55%, even if pre-approval timing feels early. Seven basis point moves can cost hundreds of dollars annually, and rate volatility is unpredictable over the next eight weeks. Focus search activity on metros with 4.5-plus months of inventory like Sacramento, Phoenix, and parts of Florida. Pricing power has shifted toward buyers and negotiation on price, closing costs, or repairs is more viable.
Use median days on market as a timing tool. If a target property has been listed longer than 45 days and the market median is 38, the seller is likely feeling pressure and may accept a below-ask offer.
Sellers:
Price at or slightly below recent comparable sales if inventory in your submarket is above four months. Early March data shows homes priced conservatively are moving in 30 to 40 days, while overpriced listings are stalling and requiring cuts. Stage, photograph professionally, and list by mid-March to capture buyers before inventory peaks in April. Waiting until late April means competing with a larger supply of fresh listings.
If you hold a sub-4% mortgage rate, model the full cost of moving. New rate, closing costs, potential price appreciation versus staying put. Current modest price gains of 0.9% year over year nationally may not justify the financing penalty of selling and re-buying at 6.6%.
Investors:
Target multifamily or small rental properties in Midwest and South metros where rent growth is outpacing for-sale price appreciation. Cash-flow spreads remain viable even at 6.6% mortgage rates. Avoid chasing for-sale inventory buildups in the West as a bargain hunting opportunity unless you can pay cash or secure seller financing. Cap-rate compression from high rates can erase discount gains quickly.
Monitor pending sales and days on market trends weekly to identify submarkets where inventory is building faster than buyer demand. Creating short-term negotiation windows before seasonal demand kicks in.
Final Words
In the action, we ran through the latest weekly national median home price, the weekly and year-over-year moves, inventory and days-on-market, and the current mortgage-rate picture.
We then showed regional contrasts, explained the demand, rate, and supply drivers behind the moves, and gave a 4–8 week outlook.
Finally, buyers, sellers, and investors got clear, practical steps to use this week’s data.
Keep this weekly national home price snapshot and actionable takeaways in your checklist — they make quick decisions easier and sharpen your next move.
FAQ
Q: What is the 3-3-3 rule in real estate?
A: The 3-3-3 rule in real estate is an agent shorthand with several meanings. Commonly it guides listing timing: market hard for the first 3 days, reassess at 3 weeks, and reprice or change strategy by 3 months.
Q: What is the hardest month to sell a house?
A: The hardest month to sell a house is typically December because holidays and cold weather reduce buyer activity; January and February also tend to be slow in many markets.
Q: Is there going to be a housing crash in 2026?
A: Whether there will be a housing crash in 2026 is uncertain. Most forecasters expect cooling or regional corrections, not a nationwide collapse; watch mortgage rates, unemployment, and inventory for signs.
Q: What is the average home price appreciation in the US?
A: The average home price appreciation in the US is about 3 to 5% annually over the long term, though recent years often ran higher; local markets and timeframes change that figure.