

Think rent can’t rise while vacancy ticks up? Think again.
This week, national vacancy hit 6.2%, up 0.1 ppt, while median asking rent reached $1,650, up 0.3% month over month and 4.8% year over year.
I’ll explain what those moves mean for renters, owners, and investors: why momentum is cooling, which weekly metrics matter, and the concrete signs that would change the picture.
No fluff. Just the numbers and what to do.
National Weekly Rental Market Snapshot With Vacancy Rates and Rent Growth

Week of March 17–23, 2026: national vacancy settled at 6.2%, up 0.1 percentage point from the prior week. National median asking rent hit $1,650, climbing 0.3% month over month and 4.8% year over year. These figures capture what happened across rental markets over the past seven days, smoothed through a 4-week rolling average to cut through daily volatility.
Vacancy rate shows the percent of empty rental units: vacant units ÷ total units × 100. So a market with 10,000 rental units and 620 sitting vacant lands at 6.2% vacancy. Rent growth tracks price change between periods: current rent minus prior rent, divided by prior rent, times 100. When median rent jumps from $1,575 to $1,650 over twelve months, you get (1,650 − 1,575) ÷ 1,575 = 4.76%, roughly 4.8%.
Direction matters as much as the number itself. A one-tenth-point vacancy bump paired with 4.8% annual rent growth tells you tightening is slowing, but landlords haven’t lost pricing power yet. Month-over-month rent growth of 0.3% annualizes near 3.6% if it holds, sitting below the trailing twelve-month pace. That gap warns landlords and investors: momentum is cooling.
Key metrics from the week:
- National vacancy rate: 6.2%
- Weekly point change: +0.1 ppt
- National median asking rent: $1,650
- Month-over-month rent growth: +0.3%
- Year-over-year rent growth: +4.8%
Vacancy Rate Fundamentals for Weekly Rental Market Tracking

Vacancy rate is straightforward math: vacant units ÷ total units × 100. Weekly updates track point changes (ppt): this week’s rate minus last week’s. A shift from 6.1% to 6.2% is a +0.1 ppt move. Investors and property managers watch this number to see whether supply is flooding in or tightening faster than expected. Physical vacancy counts empty doors. Economic vacancy measures lost income, calculated as (gross potential rent − actual rental income) ÷ gross potential rent × 100. A building might show 7% physical vacancy but 12% economic vacancy if concessions and discounted renewals are cutting actual revenue below asking rents.
Weekly vacancy data carries noise that monthly or quarterly reports filter out. Duplicate listings inflate apparent vacancy when the same unit shows up on multiple platforms. Short-term rentals blur the line between rental inventory and transient lodging; most weekly snapshots exclude them unless the focus is Airbnb or corporate housing supply. Seasonality drives predictable swings. Summer leasing peaks lower vacancy, winter troughs raise it, so year-over-year comparisons often reveal the real trend better than week-to-week deltas. Then there’s the lag problem: vacancy reported this week might reflect units listed ten days ago, and rental-listing feeds update unevenly across metros.
Common mistakes in weekly vacancy tracking:
- Treating seasonal spikes as permanent supply problems without checking normal leasing cycles.
- Counting duplicate listings across portals as separate vacant units, overstating real availability.
- Mixing short-term rental inventory into long-term vacancy calculations without flagging it.
- Trusting stale snapshots when actual conditions shifted days ago.
How Rent Growth Is Calculated in Weekly Rental Market Updates
Rent growth measures percent change in median or mean asking rent between two periods: (current rent − prior rent) ÷ prior rent × 100. If median rent rose from $1,575 last year to $1,650 this year, year-over-year growth is (1,650 − 1,575) ÷ 1,575 = 0.0476, or 4.76%. Round to 4.8%. Month-over-month growth uses the same formula but compares this month to last. Weekly snapshots usually report a four-week rolling average to smooth single-week noise.
Effective rent adjusts asking rent for concessions. When a landlord offers one month free on a twelve-month lease, effective annual rent equals (11 ÷ 12) × asking rent, about 8% below the headline. Plenty of landlords advertise asking rents but grant concessions to fill vacancies faster, so effective rent growth can lag or even turn negative while asking rents still tick higher. Four-week averaging smooths random spikes from a single large building hitting the market or a temporary listing pause. It balances responsiveness with stability, giving you a clearer read on momentum without daily whiplash.
| Metric Type | Definition |
|---|---|
| MoM (month over month) | Percent change in rent from the prior calendar month to the current month. |
| YoY (year over year) | Percent change in rent from the same week or month one year ago. |
| Effective rent | Asking rent adjusted downward for concessions (free months, discounted fees). |
| 4‑week average | Rolling mean of the past four weeks, smoothing weekly noise and one-off outliers. |
Weekly Interaction Between Vacancy Rates and Rent Growth Trends

Vacancy and rent growth move in opposite directions under normal supply and demand mechanics. When vacancy falls below 4%, landlords gain pricing power. Units lease faster, concessions shrink, rent growth picks up speed. Between 4% and 7% vacancy, the market runs roughly balanced: moderate rent growth continues, but neither landlords nor tenants hold overwhelming leverage. Above 7%, tenant-friendly conditions show up. Landlords start offering concessions, rent growth slows or stalls, days on market stretch out.
Rising vacancy paired with falling rent growth signals a softening market. New supply is outpacing demand, tenants have more options, landlords compete on price or incentives. Falling vacancy and accelerating rent growth point to tightening: demand is absorbing inventory faster than it hits the market, and landlords can push renewal and new-lease pricing higher. A divergence (vacancy rising while rent growth holds steady) often means landlords are using concessions to prop up headline rents, hiding real pricing pressure in the effective-rent numbers.
Weekly updates catch these shifts earlier than monthly or quarterly reports. A sudden half-point jump in vacancy might look small on a chart. But if it persists across four consecutive weeks and rent growth decelerates from 5% to 3% year over year, the trend is obvious: the market is loosening, pricing power is fading.
Common drivers of weekly vacancy and rent-growth changes:
- New supply hitting the market (apartment communities reaching lease-up, single-family build-to-rent completions).
- Employment shifts (layoffs reducing household formation, job growth pulling in renters).
- Population migration (in-migration tightening markets, out-migration raising vacancy).
- Concessions and lease incentives (landlords lowering effective rent to protect asking-rent comps).
- Seasonal leasing patterns (spring and summer demand peaks, winter slowdowns).
Weekly Regional and Metro-Level Rental Market Differences

National averages hide local reality. One metro can tighten while another drowns in new inventory, both trends running simultaneously in the same weekly snapshot. Regional breakdowns and metro-level data show you where landlords still control pricing and where tenants can push back hard.
Metro A, a large coastal market, reported 3.8% vacancy this week, down 0.2 percentage points from last week. Median rent stood at $2,450, with year-over-year growth of 2.2%. Tight zoning and limited new construction keep supply locked down. Even modest demand holds vacancy low and supports slow, steady rent increases. Metro B, a midsize Sunbelt city, posted 8.5% vacancy, up 0.4 ppt week over week, with median rent at $1,350 and year-over-year growth of 6.9%. The contradiction (high vacancy and strong rent growth) reflects pent-up migration demand colliding with a wave of new completions. Rents are rising because last year’s baseline was depressed, but current vacancy warns that growth might decelerate soon.
Metro C, a Midwest hub, held steady at 5.1% vacancy with a median rent of $1,050 and 3.0% year-over-year growth. Balanced supply and demand produce moderate movement in both directions. Metro D, a high-cost tech center, saw vacancy climb to 7.2%, up 0.6 ppt, while median rent reached $2,900 but year-over-year growth turned negative at −1.5%. Layoffs and remote-work relocations drained tenant demand as luxury towers finished construction, pushing vacancy higher and forcing landlords to cut asking rents or pile on concessions.
| Metro | Vacancy | Weekly Change | Median Rent | YoY Rent Growth |
|---|---|---|---|---|
| Metro A (coastal) | 3.8% | −0.2 ppt | $2,450 | +2.2% |
| Metro B (Sunbelt) | 8.5% | +0.4 ppt | $1,350 | +6.9% |
| Metro C (Midwest) | 5.1% | 0.0 ppt | $1,050 | +3.0% |
| Metro D (tech hub) | 7.2% | +0.6 ppt | $2,900 | −1.5% |
Weekly Rental Trends by Unit Type and Property Category
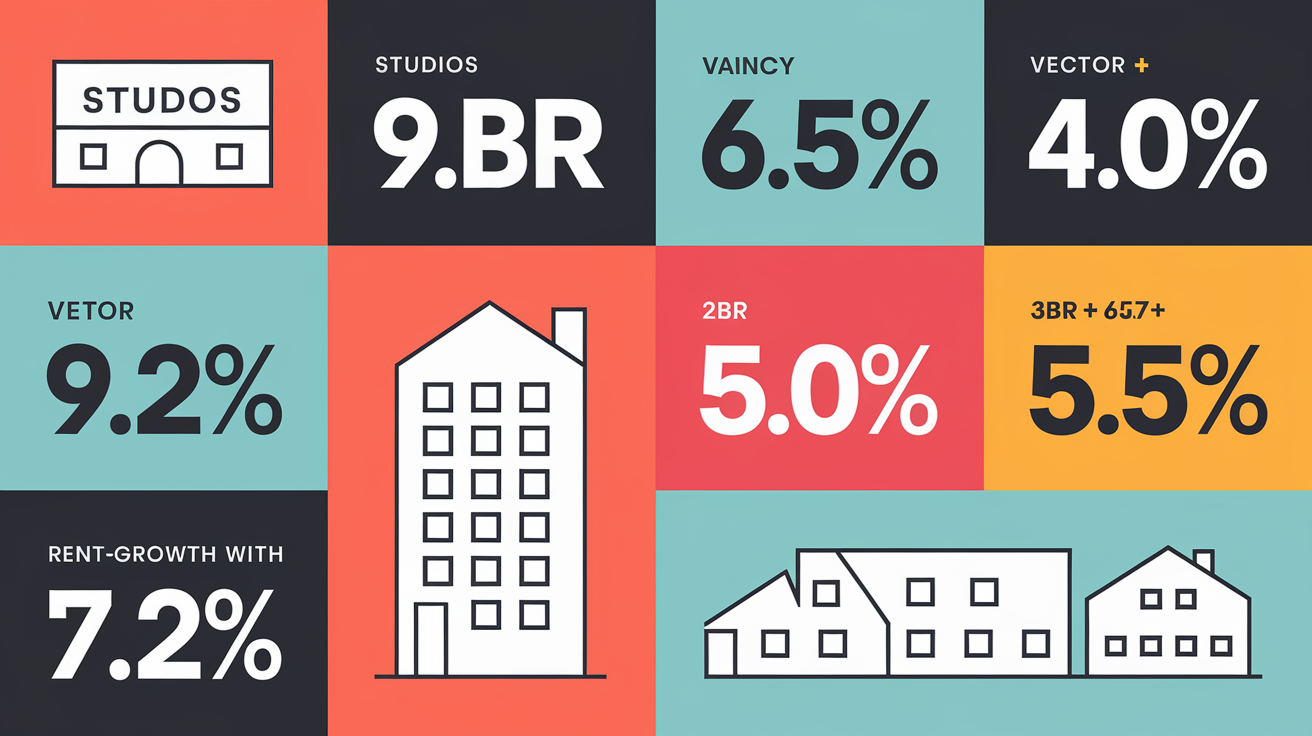
Vacancy and rent growth shift sharply by bedroom count and property type. Studios recorded 9.0% vacancy in the current week, the highest among unit types, with year-over-year rent growth of just 1.2%. One-bedroom units posted 6.5% vacancy and 4.0% growth. Two-bedroom apartments showed 5.0% vacancy and 5.5% growth, while three-bedroom-plus units held the tightest inventory at 4.2% vacancy and the strongest rent growth at 7.1%.
The pattern reflects family-rental demand outpacing solo and couple households. Remote work and lifestyle shifts pushed more renters toward larger units, tightening the 2BR and 3BR segments. Studios, concentrated in downtown cores and near campuses, face headwinds from hybrid work reducing urban foot traffic and students doubling up or living at home longer. Multifamily communities dominate the studio and 1BR supply. Single-family rentals skew heavily toward 3BR stock, further segmenting performance by asset class.
Weekly updates often show property-type divergence within the same metro. Luxury high-rise vacancy may spike while garden-style suburban complexes stay near full occupancy, driven by different tenant profiles, price points, and location preferences.
Unit-type rent-growth and vacancy summary:
- Studios lead in vacancy (9.0%) and trail in rent growth (1.2%), signaling oversupply or weak demand in urban cores.
- 1BR units show moderate vacancy (6.5%) and mid-tier growth (4.0%), balancing solo renters and couples.
- 2BR apartments tighten further (5.0% vacancy) with solid growth (5.5%), reflecting steady household formation.
- 3BR+ rentals hold the lowest vacancy (4.2%) and strongest growth (7.1%), driven by families and remote-work space needs.
Historical and Seasonal Context for Weekly Vacancy and Rent Growth Metrics

A single week’s number means nothing without historical anchors. Over the past twelve months, national vacancy peaked at 8.1% on November 15, 2024, as winter leasing slowed and a wave of new apartments finished construction. The twelve-month low of 2.9% happened on August 1, 2021, during the post-reopening migration surge when inventory was scarce and rents spiked month after month.
Seasonal patterns are reliable. Vacancy typically bottoms in late summer when families lease before school starts and young professionals move after graduation. Winter months see fewer movers, higher turnover costs, and reluctance to list units during the holidays, pushing vacancy higher. Four-week moving averages filter this seasonality, letting weekly reports surface real trend changes instead of predictable calendar effects. Seasonally adjusted series go further, mathematically removing the average seasonal swing so that a 0.2 ppt weekly rise in January can be compared directly to a 0.2 ppt rise in July without false conclusions.
Year-over-year comparisons strip out most seasonality automatically. Comparing this March to last March controls for spring leasing patterns and isolates the structural change in supply or demand. Month-over-month figures stay useful for speed but carry more noise. A sharp one-month move may reverse the next month if driven by a single large property hitting the market or a temporary weather event delaying move-ins.
Key Drivers Behind Weekly Rental Market Movements

Employment and wage trends anchor rental demand. When payrolls grow and wages rise faster than rents, household formation picks up speed and vacancies fall. Job losses or wage stagnation reduce tenant quality, increase late payments, and push some renters to double up or move in with family, raising effective vacancy even without new supply. Population migration reshapes markets weekly. A metro gaining 1,000 net migrants a month can absorb new construction that would flood a stagnant market. Out-migration turns modest supply into a glut.
New housing starts signal future pressure. Building permits filed this quarter become completions six to eighteen months later. Tracking the pipeline lets investors and landlords see when vacancy will jump. Construction completions hit rental inventory immediately. When a 300-unit tower goes from zero to lease-up, vacancy can spike 0.5 to 1.0 percentage points in a smaller metro within weeks. Household formation slowdowns, driven by economic uncertainty or demographic shifts, directly reduce gross rental demand. Fewer new households means fewer new leases, even if population stays flat.
Concessions distort headline rent growth. A landlord offering two months free on a twelve-month lease lowers effective rent by roughly 16%, but many listing feeds report only the asking rent. As concessions spread, asking rents may hold steady or inch higher while effective rents stagnate or fall, creating a false signal of market strength. Weekly updates that adjust for average concessions in each metro provide clearer trend visibility. Understanding rental demand, vacancy, and rent levels helps investors and managers decode these interactions and separate structural trends from tactical pricing moves.
Major drivers of weekly vacancy and rent-growth shifts:
- Employment growth or contraction (payroll reports, unemployment claims, local hiring announcements).
- Net migration flows (U-Haul rates, moving-company data, population estimates).
- New supply additions (building permits filed, construction starts, certificate-of-occupancy filings).
- Completions entering lease-up (ribbon cuttings, first occupancy dates, new MLS listings).
- Household formation trends (marriage rates, divorce rates, young-adult living arrangements).
- Concession activity (months free, waived fees, discounted parking or pet rent).
Weekly Implications for Landlords, Investors, Property Managers, and Tenants

Landlords watching vacancy drop below 4% should consider renewal rent increases in the 3% to 6% range and tighten concession windows. Strong demand lets you push pricing without risking high turnover. When vacancy climbs above 7%, expect tenant leverage to rise. Offering one to two months free becomes standard in competitive submarkets, and you may need to relax credit or income screening slightly to fill units faster and avoid carrying months of lost rent.
Property managers should adjust marketing spend week by week. In tight markets (vacancy under 4%), pull back on paid ads and deploy automatic renewal offers with modest increases, saving budget for retention perks like small unit upgrades. In loose markets (vacancy over 7%), increase digital marketing, refresh listing photos, be ready to negotiate lease terms. Monitoring unit-level and portfolio-level vacancy weekly prevents surprises at month-end and lets you pivot pricing or incentives before competitor properties flood the market.
Investors face cap-rate pressure when vacancy rises and rent growth turns negative. Weekly data showing sustained vacancy gains, especially if paired with a visible supply pipeline, signals near-term income risk and potential valuation compression. Prioritize properties in supply-constrained submarkets with strong job growth. Avoid overexposed metros where thousands of new units are scheduled for delivery in the next twelve months unless purchase price reflects that risk. Benchmarking your property’s vacancy against the market rate using resources like vacancy rate calculations clarifies whether underperformance stems from asset-specific issues (location, condition, management) or systemic oversupply.
Tenants in markets with vacancy above 7% hold negotiating power. Ask for one or two months free, request flexible lease start dates, push for lower security deposits or waived pet fees. In tight markets, speed matters more than price haggling. Complete applications quickly and be ready to sign the day you tour. Weekly vacancy updates tell you when the leverage is shifting and when to act.
Recommended weekly actions by stakeholder:
- Review comparable listings in your submarket to confirm your pricing aligns with current inventory and concessions.
- Evaluate concession trends across competitors. If three nearby properties offer one month free, match or differentiate on unit quality.
- Adjust renewal pricing based on portfolio vacancy. If your building is 95% occupied and metro vacancy is 7%, you have room to push renewals higher.
- Monitor the supply pipeline for new permits and completions. A 500-unit project six months from delivery may force preemptive pricing adjustments.
Short-Term Forecast and Scenario Modeling for Vacancy Rates and Rent Growth

Weekly nowcasting uses recent momentum to project the next four weeks. Take the current four-week average vacancy, add 0.25 times the most recent weekly delta, and you get a simple forward estimate. If the four-week average vacancy is 6.0% and last week’s change was +0.2 ppt, the projection for four weeks ahead is roughly 6.0% + (0.25 × 0.2) = 6.05%. A small continued rise. This method assumes no major shocks and that recent trends persist.
Scenario modeling layers in known risks. A metro with 5,000 units in the construction pipeline may see vacancy rise by 0.7 to 1.2 percentage points over the next twelve months, depending on absorption pace and whether demand holds steady or softens. Optimistic scenarios assume job growth and in-migration absorb new supply quickly, holding vacancy near current levels and supporting modest rent growth. Baseline cases expect gradual loosening. Vacancy ticks up a few tenths, rent growth slows but stays positive. Downside scenarios combine oversupply with demand shocks (layoffs, out-migration, economic uncertainty), pushing vacancy sharply higher and forcing rent cuts or heavy concessions.
Leading indicators for weekly forecasts include weekly mortgage-rate moves (higher rates slow for-sale turnover, trapping would-be buyers in rentals), employment reports (strong payrolls support household formation), and building-permit trends (permits filed today become vacancy pressure in six to twelve months). Tracking these inputs weekly sharpens the nowcast and flags inflection points before they show up in lagging rent comps.
| Scenario | Vacancy Outlook (next 12 weeks) | Rent Growth Outlook (YoY) |
|---|---|---|
| Optimistic | Flat to −0.2 ppt (demand absorbs supply) | +4.5% to +5.5% (pricing power holds) |
| Baseline | +0.3 to +0.6 ppt (gradual loosening) | +2.5% to +3.5% (growth slows, stays positive) |
| Downside | +1.0 to +1.5 ppt (oversupply, weak demand) | 0% to −2.0% (concessions or rent cuts required) |
Final Words
National snapshot: vacancy is 6.2% (weekly +0.1 ppt) while median asking rent is $1,650 — MoM +0.3%, YoY +4.8% (2026-03-17 to 2026-03-23).
That 6.2% sits in the 4–7% balanced band; the small weekly rise points to modest loosening, not a market flip.
For a practical weekly rental market update vacancy rates and rent growth explained, watch weekly ppt moves, median rent swings, and the new-supply pipeline. Do that and you’ll make clearer, calmer decisions.
FAQ
Q: What is the 2% rule for rentals?
A: The 2% rule for rentals says a property should rent for about 2% of its purchase price each month, a quick cash‑flow screen; it’s rare in many metros and not a financing rule.
Q: What is the 50/30/20 rule for rent?
A: The 50/30/20 rule divides income: 50% needs, 30% wants, 20% savings; rent usually counts as a “need,” so keep housing costs (rent plus utilities) within that 50% budget slice.
Q: What does a 5% vacancy rate mean?
A: A 5% vacancy rate means 5% of a market’s rental units are empty (vacant units ÷ total units × 100); it signals relatively tight conditions and usually supports stable or rising rents.
Q: What is the ideal rental vacancy rate?
A: The ideal rental vacancy rate is roughly 4–7%; that’s a balanced market—below 4% favors landlords (tight), above 7% favors tenants (soft), so 5–6% is often considered healthy.